| E1.7 |
Valuation methodology |
| |
The group’s policy is to obtain independent valuations of the investment properties and to report investment properties at that value.
The South African properties are independently valued, every six months, while properties held by subsidiaries or associates of AttAfrica
and Hystead are independently valued on an annual basis.
The valuation methods applied by independent valuers are the same as those used in the prior year. |
| E1.7.1 |
Who |
| |
Valuations of the South African investment properties were performed by valuers who are all registered valuers in terms of section 19
of the Property Valuers Professional Act 47 of 2000. Valuations of the non-South African properties were performed by valuers who are
members of the Royal Institution of Chartered Surveyors (RICS), as detailed below:
| Company and lead valuer |
|
Qualification |
|
Properties valued |
Viking Valuation
Trevor King Managing director |
|
BSc Hons (Building Science, UCT), Dip Surveying (UK, Reading University),
Professional Registered Valuer and member of SA Council for the
Property Valuers Profession, Chartered Valuation Surveyor and Associate
Member of the Royal Institute of Chartered Surveyors (MRICS). |
|
Eight South African
properties
(retail and office) |
Jones Lang LaSalle (JLL)
Joshua Askew
Head of valuation: Sub-Saharan Africa, National Director |
|
BA (Hons) English and philosophy, MA Property Valuations and Property
Law, Fellow of and Registered Valuer of the Royal institute of Chartered
Surveyors (FRICS and RICS), Licensed Pfandbrief MLV Valuer, Recognised
European Valuer. |
|
The Glen and Clearwater
Mall (retail) |
Mills Fitchet
Thomas Bate Partner/member |
|
BSc (Urban Land Economics) University of Westminster London,
MSc (Reading University UK), Chartered Valuation Surveyor (RICS). |
|
Ikeja City Mall (Lagos,
Nigeria) (retail) |
|
| E1.7.2 |
How |
| |
Details of the valuation methodologies used in valuing investment property, as well as the significant unobservable inputs used, are set
out in the table below:
| Type |
|
Valuation methodology |
|
Unobservable inputs |
|
Inter-relationship between
unobservable inputs and fair
value measurement |
| Investment properties– continuing operations |
|
Discounted cash flow: The valuation models
calculate the present value of the future net
cash flows expected to be generated by each
investment property. The cash flow projections
include specific estimates for five years. The
expected net cash flows are discounted using
a risk adjusted discount rate as well as a risk
adjusted cap rate. |
|
- Estimated rentals at
the end of the lease
- Vacancy levels
- Discount rate, and
- Reversionary
capitalisation rate.
|
|
The estimated fair value
increases if:
- The estimated rentals
increase
- Vacancy levels decline,
- Discount rates (market
yields) decline or
- Reversionary
capitalisation rates
decline
(and vice versa).
|
| Investment properties –
held-for-sale |
|
Fair value less costs to sell: Investment property
held-for-sale is measured at fair value less costs
to sell (FVLCTS) which, in instances where the
property is already sold, but not yet transferred,
is based on the sale price. |
|
- Estimated rentals at
the end of the lease
- Vacancy levels
- Discount rate, and
- Reversionary
capitalisation rate,
and
- Costs to sell.
|
|
|
| E1.7.3 |
Valuation assumptions |
| |
The key assumptions used by the valuers in determining the fair values of the investment properties are in the following ranges:
| |
GROUP |
|
|
COMPANY |
|
| |
30 June 2019
% |
30 June 2018
% |
|
|
30 June 2019
% |
30 June 2018
% |
|
| Unobservable inputs |
|
|
|
|
|
|
|
| Reversionary capitalisation rates |
6,5 to 8,8 |
6,3 to 8,5 |
|
|
6,5 to 8,8 |
6,3 to 8,3 |
|
| Weighted average reversionary capitalisation rates |
6,9 |
6,7 |
|
|
6,8 |
6,6 |
|
| Discount rate |
10,5 to 14,3 |
12,3 to 14,5 |
|
|
12,3 to 14,3 |
12,3 to 14,3 |
|
| Weighted average discount rate |
12,4 |
12,4 |
|
|
12,5 |
12,5 |
|
| Retail vacancy levels |
0,3 to 2 |
0,5 to 2 |
|
|
0,3 to 2 |
0,5 to 2 |
|
| Office vacancy levels |
0,5 to 0,8 |
0,5 to 2 |
|
|
0,5 to 0,8 |
0,5 to 2 |
|
| Average market rental growth rate |
5,8 |
6,0 |
|
|
5,8 |
6,0 |
|
|
| E1.7.4 |
Valuation sensitivity |
| |
The valuations of the investment properties are sensitive to changes in the unobservable inputs used in such valuations. Changes to one
of the unobservable inputs, while holding the other inputs constant, would have the following effects on the fair value of investment
property in the statement of profit or loss.
| |
|
|
|
GROUP |
|
|
COMPANY |
|
| |
|
|
|
(decreases are indicated by brackets) |
|
| Input |
June 2019
% change |
June 2018
% change |
|
30 June 2019
R000 |
30 June 2018
R000 |
|
|
30 June 2019
R000 |
30 June 2018
R000 |
|
| Increase in reversionary capitalisation rates |
0,25 |
0,25 |
|
723 337 |
760 237 |
|
|
723 337 |
721 666 |
|
| Decrease in reversionary capitalisation rates |
0,25 |
0,25 |
|
(778 519) |
(817 786) |
|
|
(778 519) |
(776 878) |
|
| Increase in discount rate |
0,25 |
0,25 |
|
274 057 |
293 838 |
|
|
274 057 |
274 435 |
|
| Decrease in discount rate |
0,25 |
0,25 |
|
(277 580) |
(297 617) |
|
|
(277 580) |
(277 962) |
|
| Increase in average market rental growth rate |
0,25 |
0,25 |
|
279 416 |
281 791 |
|
|
261 581 |
262 889 |
|
| Decrease in average market rental growth rate |
0,25 |
0,25 |
|
(302 940) |
(305 515) |
|
|
(283 603) |
(285 021) |
|
| * |
Prior year sensitivities have been recalculated to take into account time value. |
|
| E1.8 |
Mortgaged properties |
| |
First mortgage bonds have been registered over South African investment property as well as sub-Saharan African investment property
as security for secured interest-bearing borrowings.
In the case of Standard Bank and Rand Merchant Bank, properties are mortgaged to secure a pool of both consolidated and
non-consolidated borrowings.
| |
|
|
GROUP |
|
|
COMPANY |
|
| |
Note |
|
30 June 2019
R000 |
30 June 2018
R000 |
|
|
30 June 2019
R000 |
30 June 2018
R000 |
|
| Fair value of investment property mortgaged as security |
|
|
25 299 216 |
25 507 201 |
|
|
23 360 700 |
23 437 847 |
|
| Comprising: Canal Walk, The Glen, Somerset Mall, Woodlands Boulevard, Clearwater Mall, Ikeja City Mall (held-for-sale) and Atterbury Value Mart. |
|
|
|
|
|
|
|
|
|
| Total secured borrowings |
H1.4 |
|
(10 760 655) |
(10 986 353) |
|
|
(4 190 131) |
(6 283 679) |
|
| Secured borrowings (consolidated) |
|
|
(4 229 324) |
(5 302 213) |
|
|
1 558 308 |
(599 539) |
|
| Secured borrowings held-for-sale (consolidated) |
|
|
(782 892) |
– |
|
|
– |
– |
|
| Secured borrowings (non-consolidated)(1) |
|
|
(5 748 439) |
(5 684 140) |
|
|
(5 748 439) |
(5 684 140) |
|
|
|
|
|
|
|
|
|
|
|
| (1) |
Non-consolidated borrowings comprise loans advanced to Hystead Limited and its subsidiaries, which have been guaranteed by Hyprop Investments Limited.
Hyprop’s obligations under these guarantees are secured by mortgage bonds over certain of Hyprop’s properties as described above. |
|
| E1.9 |
Straight-line rental income accrual |
| |
| |
GROUP |
|
|
COMPANY |
|
| |
30 June 2019
R000 |
30 June 2018
R000 |
|
|
30 June 2019
R000 |
30 June 2018
R000 |
|
| Balance at the beginning of the year |
550 182 |
553 119 |
|
|
530 316 |
535 012 |
|
| Foreign currency translation difference |
650 |
910 |
|
|
– |
– |
|
| Reversal during the year |
(87 887) |
(3 847) |
|
|
(81 399) |
(4 696) |
|
| Reallocated to assets-held-for-sale |
(14 028) |
– |
|
|
– |
– |
|
| Balance at the end of the year |
448 917 |
550 182 |
|
|
448 917 |
530 316 |
|
|
| E2.1 |
Accounting policy |
| |
Building appurtenances and tenant installations are carried at cost less accumulated depreciation and any accumulated impairment
losses. Depreciation is provided on all building appurtenances and tenant installations to write down the cost, to the estimated residual
value, in equal monthly instalments over the estimated useful lives of the assets as follows:
Building appurtenances – 3 to 15 years
Tenant installations – period of lease
Depreciation methods, useful lives and residual values are reviewed at each reporting date and adjusted if necessary. There were no
adjustments in the current and prior years.
Subsequent expenditure is capitalised when it is probable that future economic benefits will flow to the group and the cost thereof
can be reliably measured. All other expenditure is recognised as an expense in the period in which it is incurred.
Gains or losses on the disposal of building appurtenances and tenant installations are recognised in profit or loss and are calculated as
the difference between the proceeds and the carrying value of the item sold. |
| E2.2 |
Net carrying value |
| |
| |
GROUP |
|
|
COMPANY |
|
| |
30 June 2019
R000 |
30 June 2018
R000 |
|
|
30 June 2019
R000 |
30 June 2018
R000 |
|
| Cost |
|
|
|
|
|
|
|
| Building appurtenances |
256 158 |
234 018 |
|
|
256 158 |
223 444 |
|
| Tenant installations |
77 338 |
68 475 |
|
|
77 338 |
68 475 |
|
| Total cost |
333 496 |
302 493 |
|
|
333 496 |
291 919 |
|
| Accumulated depreciation |
|
|
|
|
|
|
|
| Building appurtenances |
122 950 |
100 165 |
|
|
122 950 |
92 748 |
|
| Tenant installations |
48 258 |
39 260 |
|
|
48 258 |
39 260 |
|
| Total accumulated depreciation |
171 208 |
139 425 |
|
|
171 208 |
132 008 |
|
| Net carrying value |
|
|
|
|
|
|
|
| Building appurtenances |
133 208 |
133 853 |
|
|
133 208 |
130 696 |
|
| Tenant installations |
29 080 |
29 215 |
|
|
29 080 |
29 215 |
|
| Total net carrying value |
162 288 |
163 068 |
|
|
162 288 |
159 911 |
|
|
| E2.3 |
Movement for the year |
|
|
|
|
|
|
|
| |
Net carrying value – at the beginning of the year |
163 068 |
148 530 |
|
|
159 911 |
145 511 |
|
| |
Capital expenditure |
45 051 |
52 104 |
|
|
43 457 |
50 428 |
|
| |
Foreign currency translation movement |
103 |
147 |
|
|
– |
– |
|
| |
Disposals |
(201) |
– |
|
|
(201) |
– |
|
| |
Assets written off |
– |
67 |
|
|
– |
– |
|
| |
Classified as held-for-sale |
(3 524) |
369 |
|
|
(356) |
369 |
|
| |
Depreciation |
(42 209) |
(38 149) |
|
|
(40 523) |
(36 397) |
|
| |
Net carrying value at the end of the year |
162 288 |
163 068 |
|
|
162 288 |
159 911 |
|
|
| E3.1 |
Accounting policy election |
| |
| Investments in subsidiaries,
joint operations |
|
In terms of IAS 27: Investments in subsidiaries, associates and
joint arrangements, these investments can be accounted for in
the separate financial statements either at: cost; or at fair value
in accordance with IFRS 9: Financial instruments; or using the
equity method as described in IAS 28: Investments in
associates and joint ventures. |
|
The group has elected to recognise
these investments at cost less
impairments in the separate financial
statements. |
|
| E3.2 |
Profile |
| |
| |
|
|
|
|
% held(1) |
|
| Name and country of
incorporation/operation |
Status |
|
Nature of activities |
|
30 June 2019
% |
30 June 2018
% |
|
| Incorporated and operating in South Africa |
|
|
|
|
|
|
|
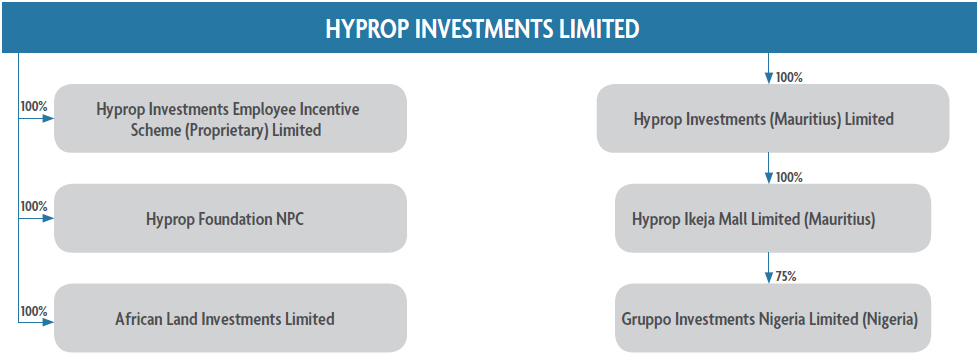
| African Land Investments
Limited |
Dormant |
|
Dormant |
|
100,0 |
100,0 |
|
| Hyprop Investments Employee
Incentive Scheme Proprietary
Limited |
Active |
|
Hedging the obligations arising from
share allocations made to employees. |
|
100,0 |
100,0 |
|
| Hyprop Foundation NPC |
Active |
|
Coordination of Hyprop’s corporate social
investment initiatives. |
|
100,0 |
100,0 |
|
| Incorporated and operating in Mauritius |
|
|
|
|
|
|
|
| Hyprop Investments
(Mauritius) Limited |
Active |
|
Indirect investment in and development of
income-producing properties in sub-Saharan
Africa (excluding SA). |
|
100,0 |
100,0 |
|
| Hyprop Ikeja Mall Limited |
Active |
|
Holding company for Gruppo. |
|
100,0 |
100,0 |
|
| Incorporated and operating in Nigeria |
|
|
|
|
|
|
|
| Gruppo Investments Nigeria
Limited |
Held-for-sale |
|
Owner of Ikeja City Mall. |
|
75,0 |
75,0 |
|
| (1) |
Proportion of ownership interest and voting power held by the group. |
|
| E3.3 |
Carrying value |
| |
| |
COMPANY |
|
| |
30 June 2019
R000 |
30 June 2018
R000 |
|
| Shares at cost |
|
|
|
| African Land |
758 264 |
758 264 |
|
| Hyprop share scheme |
* |
* |
|
| Hyprop Foundation |
* |
* |
|
| Hyprop Mauritius |
* |
* |
|
| Total cost |
758 264 |
758 264 |
|
| * |
Amounts less than R1 000. |
Details of loans to subsidiaries are set out in note F1 – Loans receivable.
The fair value of the shares in African Land has been assessed taking into account the loan payable
by Hyprop to African Land (see note H1.4). |
| E3.4 |
Movement for the year |
| |
| |
COMPANY |
|
| |
30 June 2019
R000 |
30 June 2018
R000 |
|
| Net carrying value at the beginning of the year |
758 264 |
1 156 008 |
|
| Recognition of new guarantees |
– |
102 387 |
|
| Reallocations to Loans receivable |
– |
(35 173) |
|
| Impairments(2) |
– |
(464 958) |
|
| Total net carrying value |
758 264 |
758 264 |
|
| (2) |
An impairment test was performed at year end and the investment of Hyprop Mauritius was impaired to R0 due to the negative net asset value in Hyprop
Mauritius. |
|
| E4.1 |
Accounting policy |
| |
Joint arrangements are those entities over which the group has joint control, established by contractual agreements requiring unanimous
consent for decisions about relevant activities that significantly affect the returns of the arrangements. Joint arrangements are classified
as either joint operations or joint ventures, depending on the contractual rights and obligations of the investor, and are accounted for
as follows:
| Joint operation |
– |
When the group has rights to the assets and obligations for the liabilities relating to a joint arrangement, it accounts
for its proportionate share of the assets, liabilities and transactions, including its share of those held or incurred
jointly, in relation to the joint operation, in accordance with the applicable IFRS. |
| Joint venture |
– |
When the group has rights only to the net assets of the arrangement, it accounts for its interest using the equity
method. |
| The above treatment will apply in all cases, except: |
| Held-for-sale |
– |
When the investment is classified as held-for-sale, it is accounted for in accordance with IFRS 5: Non-current assets
held-for-sale |
| Financial asset |
– |
When the investment is classified as a financial asset, it is accounted for in accordance with IFRS 9: Financial
instruments. |
|
| E4.2 |
Profile |
| |
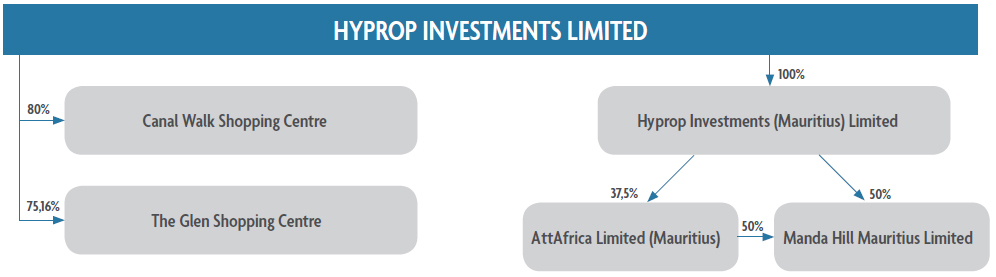
The group’s direct and indirect holdings in joint arrangements and associates are summarised below:
| |
|
|
|
Effective economic interest held % |
|
| Name |
Principal place of
business |
Partner/co-investor |
Status |
30 June 2019
% |
30 June 2018
% |
|
| Joint operations |
|
|
|
|
|
|
| Canal Walk Shopping Centre |
Cape Town, South Africa |
Ellerine Brothers |
Active |
80,00 |
80,00 |
|
| The Glen Shopping Centre |
Johannesburg, South Africa |
Ellerine Brothers |
Active |
75,16 |
75,16 |
|
| Joint ventures – held through Hyprop Mauritius |
|
|
|
|
|
|
| AttAfrica Limited(1) |
Mauritius |
Attacq |
Active |
37,50 |
37,50 |
|
| Manda Hill Mauritius Limited(2) |
Mauritius |
Attacq |
Active |
68,75 |
68,75 |
|
| (1) |
Hyprop Mauritius has a 37,5% interest in AttAfrica. The initial investment was made on 20 November 2012. Hyprop Mauritius has 50% of the voting rights on
the board of AttAfrica and, accordingly, has joint control of AttAfrica. |
| (2) |
Hyprop Mauritius has a 50% interest in Manda Hill Mauritius. AttAfrica holds the other 50% of the shares in Manda Hill Mauritius resulting in a group effective
economic interest in Manda Hill Mauritius of 68,75%. The effective date of the investment was 1 July 2014. Hyprop Mauritius has 50% of the voting rights on the
board of Manda Hill Mauritius and, accordingly, has joint control of Manda Hill Mauritius. |
|
| E4.3 |
Joint operations |
| |
Financial results for the joint operations, Canal Walk and The Glen, are proportionately consolidated in the company and group
statements of profit or loss and other comprehensive income and statements of financial position. |
| E4.3.1 |
Summary of audited financial information |
| |
Set out below is a summary of the audited financial information for the joint operations Canal Walk and The Glen.
| |
Canal Walk |
|
|
The Glen |
|
| % interest held by Hyprop |
30 June 2019
80,00%
R000 |
30 June 2018
80,00%
R000 |
|
|
30 June 2019
75,16%
R000 |
30 June 2018
75,16%
R000 |
|
| Revenue |
776 657 |
724 496 |
|
|
252 100 |
223 280 |
|
| Expenses |
(252 853) |
(227 200) |
|
|
(92 412) |
(65 973) |
|
| Interest received |
– |
1 750 |
|
|
– |
130 |
|
| Net property income |
523 804 |
499 046 |
|
|
159 688 |
157 437 |
|
| Expenses include: |
|
|
|
|
|
|
|
| Depreciation |
(313) |
(238) |
|
|
(74) |
(92) |
|
|
| E4.4 |
Joint ventures |
| E4.4.1 |
Carrying value |
| |
| |
GROUP |
|
|
COMPANY |
|
| |
30 June 2019
R000 |
30 June 2018
R000 |
|
|
30 June 2019
R000 |
30 June 2018
R000 |
|
| Shares at cost |
|
|
|
|
|
|
|
| AttAfrica |
* |
* |
|
|
* |
* |
|
| Manda Hill Mauritius |
* |
* |
|
|
* |
* |
|
| Total cost |
– |
– |
|
|
– |
– |
|
| * |
Amounts less than R1 000. |
Details of loans to joint ventures are set out in note F1 – Loans receivable. |
| E4.4.2 |
Summary of financial information |
| |
Set out below is a summary of the audited financial information for the joint ventures AttAfrica and Manda Hill Mauritius.
| |
Canal Walk |
|
|
The Glen |
|
| |
30 June 2019
100%
R000 |
30 June 2018
100%
R000 |
|
|
30 June 2019
100%
R000 |
30 June 2018
100%
R000 |
|
| Summarised statement of financial position |
|
|
|
|
|
|
|
| Non-current assets |
2 671 499 |
4 911 382 |
|
|
1 784 301 |
1 902 794 |
|
| Current assets |
118 632 |
132 254 |
|
|
42 183 |
14 226 |
|
| Non-current liabilities |
(4 874 348) |
(5 083 572) |
|
|
(1 131 302) |
(1 158 504) |
|
| Current liabilities |
(86 022) |
(721 141) |
|
|
(980 900) |
(829 596) |
|
| Net liabilities |
(2 170 239) |
(761 077) |
|
|
(285 718) |
(71 080) |
|
| Summarised statement of financial position includes: |
|
|
|
|
|
|
|
| Cash and cash equivalents |
48 930 |
54 964 |
|
|
4 409 |
7 354 |
|
| Current financial liabilities |
79 719 |
93 426 |
|
|
62 960 |
12 022 |
|
| Non-current financial liabilities |
4 657 998 |
4 380 780
|
|
|
1 131 302
|
1 158 504
|
|
| Summarised statement of profit or loss and other comprehensive income |
|
|
|
|
|
|
|
| Revenue |
274 142 |
283 396 |
|
|
169 828 |
150 620 |
|
| Loss before taxation |
(1 378 981) |
(175 788) |
|
|
(202 006) |
(27 847) |
|
| Taxation |
(120 675) |
62 751 |
|
|
(9 560) |
(12 394) |
|
| Net loss |
(1 499 656) |
(113 037) |
|
|
(211 566) |
(40 241) |
|
| Other comprehensive income (currency translation reserve) |
(25 836) |
(23 627) |
|
|
(2 377) |
(1 913) |
|
| Total comprehensive loss |
(1 525 492) |
(136 664) |
|
|
(213 943) |
(42 154) |
|
| Loss before taxation includes: |
|
|
|
|
|
|
|
| Interest income |
49 714 |
76 189 |
|
|
|
|
|
| Interest expense |
(534 582) |
(476 383) |
|
|
(86 048) |
(90 792) |
|
| Depreciation |
(7 821) |
(2 489) |
|
|
(7 071) |
(4 358) |
|
| Comprehensive (loss)/income attributable to: |
(1 525 492) |
(136 664) |
|
|
(213 943) |
(42 154) |
|
| Equity holders of the company |
(1 071 032) |
(116 106) |
|
|
(213 943) |
(42 154) |
|
| Non-controlling interest |
(454 460) |
(20 558) |
|
|
– |
– |
|
| Hyprop’s share of losses |
– |
– |
|
|
– |
– |
|
| – Share of loss from joint venture |
(401 637) |
(43 540) |
|
|
(106 972) |
(21 077) |
|
| – Limitation of loss from joint venture |
401 637 |
43 540 |
|
|
106 972 |
21 077 |
|
|
|
|
|
|
|
|
|
For further details on loans extended to these entities refer to note F1 – Loans receivable. |
| E5.1 |
Accounting policy |
| |
Where the group has a contractual right to receive its share of net distributable earnings of a financial asset, the financial asset is
designated at fair value through profit or loss (FVTPL) and initially measured at fair value. Subsequent to initial recognition, the financial
asset is measured at fair value and changes in the fair value are recognised in the consolidated statement of profit or loss and other
comprehensive income.
Any gain or loss on initial recognition (i.e. the difference between the fair value and the amount paid) is deferred where the valuation
method used to determine the fair value includes assumptions which are derived from unobservable inputs. The deferred profit or loss
is subsequently recognised in profit or loss only to the extent of a change in a factor (including time) that market participants would take
into account when pricing the asset. |
| E5.2 |
Key assumptions and estimations |
| |
The key assumptions and estimates which have an effect on the group’s investment in Hystead (which is classified as a financial asset)
are set out below:
| Control over an investee |
Management assessed whether it has control over Hystead based on the suite of agreements
which govern the relationship between the shareholders of Hystead and concluded that Hyprop
has joint control of Hystead. |
| Classification as an equity-accounted
investment or
financial instrument |
In prior years, management considered whether the investment in Hystead should be classified
as a joint venture and be equity accounted, or based on the contractual right to receive dividends
as a result of the provisions of the Hystead shareholders’ agreement, should be classified as a
financial asset.
Based on the provisions of the suite of agreements which govern the relationship between the
shareholders of Hystead, Hystead has a financial obligation to pay all of its distributable income
as a dividend to its shareholders each year. Accordingly, Hyprop accounts for the investment in
Hystead as a financial asset.
Management reassessed the classification and accounting treatment of the investment in Hystead
and concluded that the classification as a financial asset remains appropriate. |
| Valuation of financial asset and
deferral of day-one gain |
The fair value of the right to receive dividends from Hystead has been valued based on the
present value of anticipated future cash flows.
The valuation method includes assumptions derived from unobservable inputs. Management
has therefore determined that the day-one gain should be deferred. However, the fair value
movement subsequent to that date should be taken through profit or loss. |
|
| E5.3 |
Profile |
| |
 |
| E5.4 |
Carrying value and net movement for the year |
| |
| |
|
|
GROUP AND COMPANY |
|
| |
Note |
|
30 June 2019
R000 |
30 June 2018
R000 |
|
| Balance at the beginning of the year |
|
|
152 556 |
– |
|
| Net change in fair value of future cash flows |
|
|
65 888 |
152 556 |
|
| – loans receivable capitalised |
F1.4 |
|
40 716 |
30 980 |
|
| – new guarantees issued |
H3.3 |
|
110 401 |
33 815 |
|
| – fair value adjustment |
|
|
(85 229) |
87 761 |
|
|
|
|
|
|
|
| Balance at the end of the year |
|
|
218 444 |
152 556 |
|
|
| E5.5 |
Gross movement for the year |
| E5.7 |
Valuation methodology |
| |
The group performs an internal valuation of the financial asset based on the cash flows of the underlying investment property companies.
The European investment properties are independently valued each December. A directors’ valuation is carried out every June.
The following tables show the valuation techniques used in measuring the financial asset, as well as the significant unobservable
inputs used:
| Type |
|
Valuation technique |
|
Unobservable inputs |
|
Movement in input |
|
Effect on estimated fair
value |
| Financial asset– Hystead |
|
Discounted cash flow: The valuation is calculated as the present
value of the anticipated future net cash flows expected to be
generated by the underlying shopping centres after deducting
the head office costs within the Hystead group.
The cash flow projections include specific estimates for
10 years (2018: 10 years). The expected net cash flows are
discounted using a risk adjusted discount rate as well as a
risk adjusted cap rate. |
|
- Annual
growth rate
- Terminal
growth rate
- Exit cap rate
- Discount rate
|
|
Increase
Decrease
Increase
Decrease |
|
Increase
Decrease
Decrease
Increase |
|
| E5.8 |
Valuation assumptions |
| |
The key assumptions used in determining the fair value of the investment in Hystead are in the following ranges:
| |
GROUP AND COMPANY |
|
| Unobservable inputs |
30 June 2019
% |
30 June 2018
% |
|
| Financial asset – Hystead |
|
|
|
| Annual growth rate |
(1,1) to 2,5 |
(17,8) to 0,6 |
|
| Weighted average annual growth rate |
0,2 |
(0,3) |
|
| Terminal growth rate |
1,8 to 2,3 |
0,8 to 2,0 |
|
| Weighted average terminal growth rate |
1,9 |
1,5 |
|
| Discount rate |
6,0 to 8,0 |
7,0 to 8,0 |
|
| Weighted average discount rate |
6,9 |
7,4 |
|
| Exit capitalisation rates |
5,0 to 7,3 |
5,3 to 7,3 |
|
| Weighted average exit capitalisation rate |
5,8 |
5,9 |
|
|
| E5.9 |
Valuation sensitivity |
| |
The valuation of the investment in Hystead is sensitive to changes to the unobservable inputs. Changes to one of the unobservable
inputs, while holding the other inputs constant, would have the following effects on the fair value of the investment in Hystead in the
statement of profit or loss.
| |
|
|
|
|
GROUP AND COMPANY
(decreases are indicated by brackets) |
|
| Input |
|
30 June 2019
% change* |
30 June 2018
% change* |
|
30 June 2019
R000 |
30 June 2018
R000 |
|
| Annual growth rate |
Increase |
0,5 |
1,0 |
|
96 070 |
45 449 |
|
| |
Decrease |
0,5 |
1,0 |
|
(96 070) |
(45 449) |
|
| Terminal growth rate |
Increase |
0,5 |
1,0 |
|
9 150 |
2 273 |
|
| |
Decrease |
0,5 |
1,0 |
|
(9 150) |
(2 273) |
|
| Discount rate |
Increase |
0,5 |
1,0 |
|
(67 478) |
(32 951) |
|
| |
Decrease |
0,5 |
1,0 |
|
67 478 |
32 951 |
|
| Exit capitalisation rates |
Increase |
0,5 |
1,0 |
|
(68 621) |
(40 904) |
|
| |
Decrease |
0,5 |
1,0 |
|
68 621 |
40 904 |
|
| * |
The percentage change applied in each year is the possible change applicable to each input. |
|
| |
Details of approved capital expenditure for the year ended 30 June 2020 are set out below.
| |
GROUP AND COMPANY |
|
| |
30 June 2019
R000 |
30 June 2018
R000 |
|
| Approved and committed |
84 945 |
165 912 |
|
| Approved but not yet committed |
365 532 |
176 236 |
|
| Total |
450 477 |
342 148 |
|
| |
30 June 2020
Total
R000 |
|
| Yield-based projects |
241 945 |
|
| Trading density improvements |
121 475 |
|
| Replacements |
66 562 |
|
| Infrastructure projects |
20 495 |
|
| Total capital commitments* |
450 477 |
|
| * |
Excludes the cost of solar plants under evaluation. |
All the capital commitment disclosures exclude held-for-sale properties.
The capital expenditure will be financed out of available cash resources, banking facilities and debt capital market funding. |
| E7.1 |
Accounting policy |
| |
Non-current assets, or disposal groups comprising assets and liabilities, that are expected to be recovered primarily through sale rather
than through continuing use, are classified as held-for-sale. This condition is regarded as met only when the sale is highly probable and
the non-current asset or disposal group is available for sale in its present condition subject only to terms that are usual and customary
for sales of such assets. For the sale to be highly probable, the appropriate level of management must be committed to a plan to sell
the asset or disposal group.
Investment property classified as held-for-sale is measured in accordance with IAS 40: Investment property at fair value with gains or losses
on subsequent measurement being recognised in profit or loss in the line profit/(loss) on disposal – investment property. Disposal groups
and non-current assets held-for-sale are presented separately from other assets and liabilities in the statement of financial position. |
| E7.2 |
Summary of disposal group |
| |
During the year the group reviewed its strategy, resulting in a revised three-year strategic plan. This led to a decision to exit the group’s
sub-Saharan African investments within the next 12 to 18 months. As a result the group’s interest in Gruppo (which owns 100% of the
Ikeja City Mall in Lagos, Nigeria, and in which Hyprop has a 75% interest) was designated as held-for-sale. Gruppo is reported under
the sub-Saharan African operating segment.
The group’s other sub-Saharan African interests comprise its investments and loans receivable from AttAfrica and Manda Hill. It is
anticipated that these interests will be realised by repayment of the loans receivable from the proceeds on disposal of the underlying
investment properties. The loans receivable have been classified as short term and are included in current assets.
In 2018, the disposal group consisted of Lakefield Office Park, the last remaining non-core property in the portfolio, which was sold
effective 4 January 2019 for a profit of R2,8 million. Lakefield had been reported in the South African operating segment. |
| E7.3 |
Movement for the year – assets |
| |
| |
GROUP AND COMPANY |
|
| |
30 June 2019
R000 |
30 June 2018
R000 |
|
| Balance at the beginning of the year |
199 257 |
418 796 |
|
| Disposals – Lakefield(1) (2018: Willowbridge North and Greenstone Park – vacant land) |
(199 257) |
(226 607) |
|
| Additions – Gruppo (2018: Lakefield) |
2 047 847 |
7 068 |
|
| Balance at the end of the year |
2 047 847 |
199 257 |
|
|
| E7.4 |
Movement for the year – liabilities |
| |
| |
GROUP AND COMPANY |
|
| |
30 June 2019
R000 |
30 June 2018
R000 |
|
| Balance at the beginning of the year |
(8 157) |
(5 189) |
|
| Disposals – Lakefield(1) (2018: Willowbridge North and Greenstone Park – vacant land) |
8 157 |
1 468 |
|
| Additions – Gruppo (2018: Lakefield) |
(1 098 300) |
(4 436) |
|
| Balance at the end of the year |
(1 098 300) |
(8 157) |
|
| Net classified as held-for-sale |
949 547 |
191 100 |
|
| (1) |
The sale of Lakefield Office Park was finalised on 4 January 2019 and the sale proceeds received. |
|