| E. | PROPERTY INVESTMENTS AND RELATED ITEMS | ||||
| E1 | INVESTMENT PROPERTY | ||||
| E1.1 | Accounting policy | ||||
|
Investment properties are properties held to earn rental income and/or for capital appreciation. Rental income from investment property is recognised as revenue on a straight-line basis over the term of the lease. Investment property is initially recognised at cost, including transaction costs. Cost includes initial costs, costs incurred subsequently to extend or refurbish investment property and the cost of any development rights. Investment property is subsequently measured at fair value. Gains or losses arising from changes in fair value, after deducting the straight-line rental income accrual, are included in net profit or loss for the period in which they arise. These gains or losses are transferred to non-distributable reserves in the statement of changes in equity. In instances when investment property has been sold, but not yet transferred to the purchaser at year-end, the fair value is determined as the sale price. An investment property is derecognised upon disposal or when the investment property is permanently withdrawn from use and no future economic benefits are expected from the property. Any gain or loss arising on derecognition of the property is included in profit or loss in the period in which the property is derecognised. The gain or loss is calculated as the difference between the net disposal proceeds and the carrying amount of the asset. Realised gains or losses arising on the disposal of investment properties are recognised in profit or loss for the year and transferred to/from non-distributable reserves in the statement of changes in equity. |
|||||
| E1.2 | Key judgements and estimations | ||||
|
|||||
| E1.3 | Profile | ||||
 |
Refer to Section C – Segmental analysis, for a breakdown of investment property, contractual rental income and property expenses by segment.
|
|||||||||||||||||||||||||||||||||||||||||||||||||||||||||||||||||||||||||||||||||||||||||||||||||||||||||||||||||
| E1.7 | Valuation methodologys | ||||||||||||||||||||||||||||||||||||||||||||||||||||||||||||||||||||||||||||||||||||||||||||||||||||||||||||||||
|
Investment property fair value measurements are categorised as level 3 (refer to note L1.1 for the definition of level 3). The Group's policy is to obtain independent valuations of the investment properties and report investment properties at the lower of that value, or a directors' valuation based on arms-length bona fide commercial offers for specific properties. The South African properties are independently valued every six months, while properties held by subsidiaries or associates of AttAfrica and Hystead are independently valued on an annual basis. The valuation methods applied by independent valuers are the same as those used in the prior year. |
|||||||||||||||||||||||||||||||||||||||||||||||||||||||||||||||||||||||||||||||||||||||||||||||||||||||||||||||||
| E1.7.1 | Who | ||||||||||||||||||||||||||||||||||||||||||||||||||||||||||||||||||||||||||||||||||||||||||||||||||||||||||||||||
|
Valuations of the South African investment properties were performed by valuers who are all registered valuers in terms of section 19 of the Property Valuers Professional Act 47 of 2000. Valuations of the non-South African properties were performed by valuers who are members of the Royal Institution of Chartered Surveyors (RICS), as detailed below:
|
|||||||||||||||||||||||||||||||||||||||||||||||||||||||||||||||||||||||||||||||||||||||||||||||||||||||||||||||||
| E1.7.2 | How | ||||||||||||||||||||||||||||||||||||||||||||||||||||||||||||||||||||||||||||||||||||||||||||||||||||||||||||||||
|
Details of the valuation methodologies used in valuing investment property, as well as the significant unobservable inputs used, are set out in the table below:
|
|||||||||||||||||||||||||||||||||||||||||||||||||||||||||||||||||||||||||||||||||||||||||||||||||||||||||||||||||
| E1.7.3 | Valuation assumptions | ||||||||||||||||||||||||||||||||||||||||||||||||||||||||||||||||||||||||||||||||||||||||||||||||||||||||||||||||
|
The key assumptions used by the valuers in determining the fair values of the investment properties are in the following ranges:
The discount and capitalisation rates used in the property valuations are dependent on a number of factors, such as location, the condition of the improvements, current market conditions, the lease covenants and the risk inherent in the property. The current economic downturns in South Africa and Nigeria, together with the extremely difficult trading and operating conditions due to the national lockdowns and Covid-19, has prompted the valuers to assume and apply higher and more conservative discount and reversionary capitalisation rates and to revise their market rental growth rates and forecast property net operating incomes. Reversionary capitalisation rates were adjusted upwards by between 0.25% to 1.5%, from the capitalisation rates used in 2019. Discount rates were adjusted accordingly. The anticipated short-term impact of rental discounts granted to tenants as a result of Covid-19 was taken into account as a "once-off" adjustment. The independent valuers have noted in their valuation reports that, as a result of Covid-19, their valuations are reported on the basis of "material valuation uncertainty" as per VPS 3 and VPGA 10 of the RICS Red Book Global (The Royal Institute of Chartered Surveyors global valuation standards guideline). They note that, at the valuation date:
Consequently, they note that, less certainty and a higher degree of caution should be attached to the valuations than would normally be the case. Given the unknown future impact that Covid-19 might have on the real estate market, they recommend that the valuations be kept under frequent review. It is Hyprop's policy to have its consolidated investment properties independently valued every six months. |
|||||||||||||||||||||||||||||||||||||||||||||||||||||||||||||||||||||||||||||||||||||||||||||||||||||||||||||||||
| E1.7.4 | Valuation sensitivity (1) | ||||||||||||||||||||||||||||||||||||||||||||||||||||||||||||||||||||||||||||||||||||||||||||||||||||||||||||||||
|
The valuations of the investment properties are sensitive to changes in the unobservable inputs used in such valuations. Changes to one of the unobservable inputs, while holding the other inputs constant, would have the following effects on the fair value of investment property in the statement of profit or loss.
|
|||||||||||||||||||||||||||||||||||||||||||||||||||||||||||||||||||||||||||||||||||||||||||||||||||||||||||||||||
| E1.8 | Mortgaged properties | ||||||||||||||||||||||||||||||||||||||||||||||||||||||||||||||||||||||||||||||||||||||||||||||||||||||||||||||||
|
First mortgage bonds have been registered over South African investment property as well as sub-Saharan African investment property as security for secured interest-bearing borrowings. In the case of Standard Bank and Rand Merchant Bank, properties are mortgaged to secure a pool of both consolidated and non-consolidated borrowings.
|
|||||||||||||||||||||||||||||||||||||||||||||||||||||||||||||||||||||||||||||||||||||||||||||||||||||||||||||||||
| E1.9 | Straight-line rental income accrual | ||||||||||||||||||||||||||||||||||||||||||||||||||||||||||||||||||||||||||||||||||||||||||||||||||||||||||||||||
|
|||||||||||||||||||||||||||||||||||||||||||||||||||||||||||||||||||||||||||||||||||||||||||||||||||||||||||||||||
| E2 | PROPERTY, PLANT AND EQUIPMENT | ||||||||||||||||||||||||||||||||||||||||||||||||||||||||||||||||||||||||||||||||||||||||||||||||||||||||||||||||
| E2.1 | Accounting policy | ||||||||||||||||||||||||||||||||||||||||||||||||||||||||||||||||||||||||||||||||||||||||||||||||||||||||||||||||
|
Property, plant and equipment is carried at cost less accumulated depreciation and any accumulated impairment losses. Depreciation is provided on all property, plant and equipment to write down the cost, to the estimated residual value, in equal monthly instalments over the estimated useful lives of the assets, as follows:
Depreciation methods, useful lives and residual values are reviewed at each reporting date and adjusted if necessary. There were no adjustments in the current and prior years. Subsequent expenditure is capitalised when it is probable that future economic benefits will flow to the Group and the cost thereof can be reliably measured. All other expenditure is recognised as an expense in the period in which it is incurred. Gains or losses on the disposal of property, plant and equipment are recognised in profit or loss and are calculated as the difference between the proceeds and the carrying value of the item sold. |
|||||||||||||||||||||||||||||||||||||||||||||||||||||||||||||||||||||||||||||||||||||||||||||||||||||||||||||||||
| E2.2 | Net carrying value | ||||||||||||||||||||||||||||||||||||||||||||||||||||||||||||||||||||||||||||||||||||||||||||||||||||||||||||||||
| E3 | CAPITAL COMMITMENTS | |||||||||||||||||||||||||||||||||||||||||||||||||||||||||||||||||||||||||||||||||||||||||||||||||||||||||||||||||||||||||||||||||||||||||||||||||||||||||||
|
Details of approved capital expenditure for the year ended 30 June 2021 are set out below.
Capital commitments exclude held-for-sale properties. The capital expenditure will be financed from available cash resources, cash generated by operations, banking facilities and debt capital market funding. |
||||||||||||||||||||||||||||||||||||||||||||||||||||||||||||||||||||||||||||||||||||||||||||||||||||||||||||||||||||||||||||||||||||||||||||||||||||||||||||
| E4 | INVESTMENTS IN SUBSIDIARIES | |||||||||||||||||||||||||||||||||||||||||||||||||||||||||||||||||||||||||||||||||||||||||||||||||||||||||||||||||||||||||||||||||||||||||||||||||||||||||||
| E4.1 | Accounting policy election | |||||||||||||||||||||||||||||||||||||||||||||||||||||||||||||||||||||||||||||||||||||||||||||||||||||||||||||||||||||||||||||||||||||||||||||||||||||||||||
|
||||||||||||||||||||||||||||||||||||||||||||||||||||||||||||||||||||||||||||||||||||||||||||||||||||||||||||||||||||||||||||||||||||||||||||||||||||||||||||
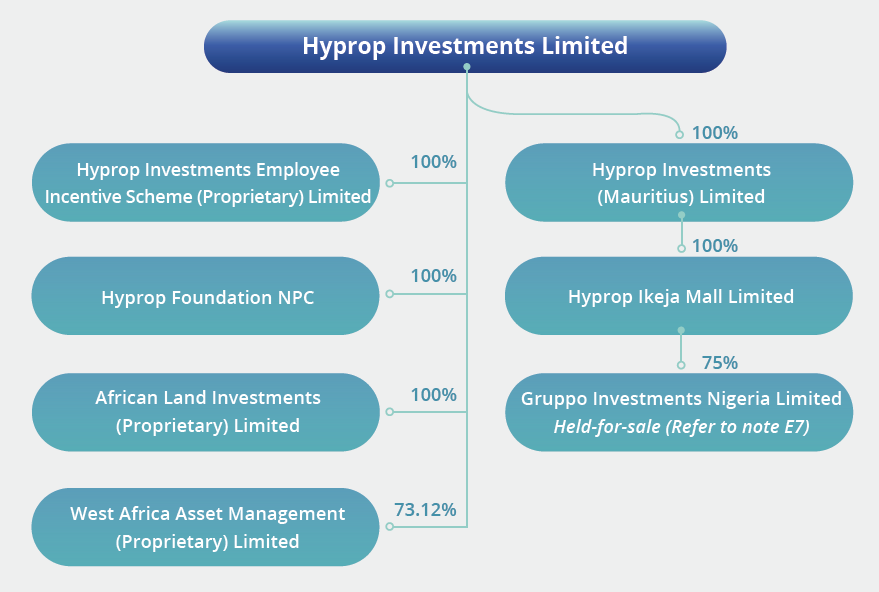
| E4.2 | Profile | |||||||||||||||||||||||||||||||||||||||||||||||||||||||||||||||||||||||||||||||||||||||||||||||||||||||||||||||||||||||||||||||||||||||||||||||||||||||||||
|
||||||||||||||||||||||||||||||||||||||||||||||||||||||||||||||||||||||||||||||||||||||||||||||||||||||||||||||||||||||||||||||||||||||||||||||||||||||||||||
| E4.3 | Carrying value | |||||||||||||||||||||||||||||||||||||||||||||||||||||||||||||||||||||||||||||||||||||||||||||||||||||||||||||||||||||||||||||||||||||||||||||||||||||||||||
* Amounts less than R1 000. The recoverability of the shares in African Land has been assessed taking into account the loan payable by Hyprop to African Land of R761m (see note H1.4). This results in a net liability of R 2.86m. The recoverability of the shares in Hyprop Mauritius has been assessed taking into account the following factors:
In calculating the recoverable amount, no probability-weighted outcomes are used as the directors have assumed a 100% loss given default on the calculated shortfall. The investment (shares) in Hyprop Mauritius and the loan receivable from Hyprop Mauritius (see note F1.4) have been impaired to nil. |
||||||||||||||||||||||||||||||||||||||||||||||||||||||||||||||||||||||||||||||||||||||||||||||||||||||||||||||||||||||||||||||||||||||||||||||||||||||||||||
| E4.4 | Movement reconciliation | |||||||||||||||||||||||||||||||||||||||||||||||||||||||||||||||||||||||||||||||||||||||||||||||||||||||||||||||||||||||||||||||||||||||||||||||||||||||||||
* Amounts less than R1 000. |
||||||||||||||||||||||||||||||||||||||||||||||||||||||||||||||||||||||||||||||||||||||||||||||||||||||||||||||||||||||||||||||||||||||||||||||||||||||||||||
| E5 | INVESTMENTS IN JOINT ARRANGEMENTS | |||||||||||||||||||||||||||||||||||||||||||||||||||||||||||||||||||||||||||||||||||||||||||||||||||||||||||||||||||||||||||||||||||||||||||||||||||||||||||
| E5.1 | Accounting policy | |||||||||||||||||||||||||||||||||||||||||||||||||||||||||||||||||||||||||||||||||||||||||||||||||||||||||||||||||||||||||||||||||||||||||||||||||||||||||||
|
Joint arrangements are those entities, assets or properties over which the Group has joint control, established by contractual agreements regarding decisions about relevant activities that significantly affect the returns of the arrangements. Joint arrangements are classified as either joint operations or joint ventures, depending on the contractual rights and obligations of the investor, and are accounted for as follows:
The above treatment will apply in all cases, except:
|
||||||||||||||||||||||||||||||||||||||||||||||||||||||||||||||||||||||||||||||||||||||||||||||||||||||||||||||||||||||||||||||||||||||||||||||||||||||||||||
| E5.2 | Key judgements and estimations | |||||||||||||||||||||||||||||||||||||||||||||||||||||||||||||||||||||||||||||||||||||||||||||||||||||||||||||||||||||||||||||||||||||||||||||||||||||||||||
|
||||||||||||||||||||||||||||||||||||||||||||||||||||||||||||||||||||||||||||||||||||||||||||||||||||||||||||||||||||||||||||||||||||||||||||||||||||||||||||
| E5.3 | Profile | |||||||||||||||||||||||||||||||||||||||||||||||||||||||||||||||||||||||||||||||||||||||||||||||||||||||||||||||||||||||||||||||||||||||||||||||||||||||||||
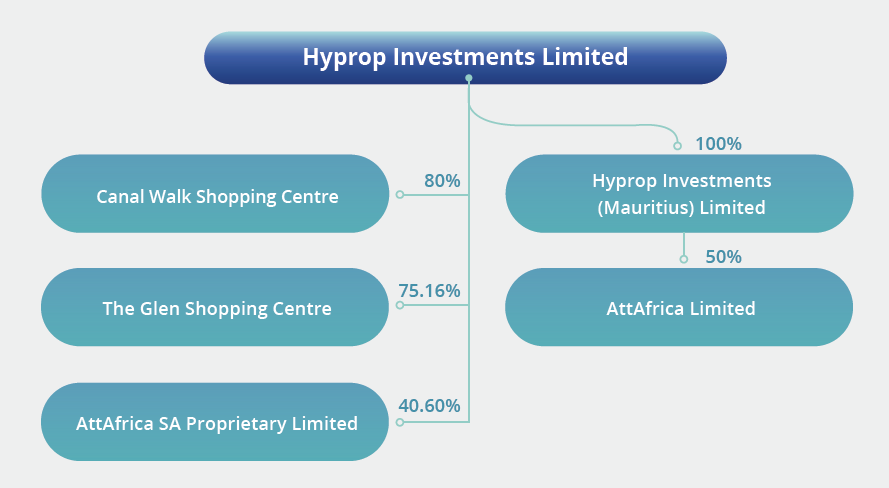 The Group's direct and indirect holdings in joint arrangements and associates are summarised below:
|
||||||||||||||||||||||||||||||||||||||||||||||||||||||||||||||||||||||||||||||||||||||||||||||||||||||||||||||||||||||||||||||||||||||||||||||||||||||||||||
| E5.4 | Joint operations | |||||||||||||||||||||||||||||||||||||||||||||||||||||||||||||||||||||||||||||||||||||||||||||||||||||||||||||||||||||||||||||||||||||||||||||||||||||||||||
|
Financial resu lts for the joint operations, Canal Walk and The Glen, are proportionately consolidated in the Company and Group statements of profit or loss and other comprehensive income and statements of financial position. |
||||||||||||||||||||||||||||||||||||||||||||||||||||||||||||||||||||||||||||||||||||||||||||||||||||||||||||||||||||||||||||||||||||||||||||||||||||||||||||
| E5.4.1 | Summary of audited financial information | |||||||||||||||||||||||||||||||||||||||||||||||||||||||||||||||||||||||||||||||||||||||||||||||||||||||||||||||||||||||||||||||||||||||||||||||||||||||||||
A summary of the audited financial information for the joint operations Canal Walk and The Glen is set out below.
|
||||||||||||||||||||||||||||||||||||||||||||||||||||||||||||||||||||||||||||||||||||||||||||||||||||||||||||||||||||||||||||||||||||||||||||||||||||||||||||
| E5.5 | Joint ventures | |||||||||||||||||||||||||||||||||||||||||||||||||||||||||||||||||||||||||||||||||||||||||||||||||||||||||||||||||||||||||||||||||||||||||||||||||||||||||||
| E5.5.1 | Carrying value | |||||||||||||||||||||||||||||||||||||||||||||||||||||||||||||||||||||||||||||||||||||||||||||||||||||||||||||||||||||||||||||||||||||||||||||||||||||||||||
* Amounts less than R1 000. During the year a portion of the loan receivable from AttAfrica was settled through a subscription for preference shares (see Notes F1.3 to F1.5). The recoverability of the ordinary and preference shares in AttAfrica has been assessed, taking into account the
In calculating the recoverable amount, no probability-weighted outcomes are used as the directors have assumed a 100% loss given default on the calculated shortfall. The investment in AttAfrica has been impaired to nil. Details of loans to joint ventures are set out in note F1 – Loans receivable. |
||||||||||||||||||||||||||||||||||||||||||||||||||||||||||||||||||||||||||||||||||||||||||||||||||||||||||||||||||||||||||||||||||||||||||||||||||||||||||||
| E5.5.2 | Summary of audited financial information | |||||||||||||||||||||||||||||||||||||||||||||||||||||||||||||||||||||||||||||||||||||||||||||||||||||||||||||||||||||||||||||||||||||||||||||||||||||||||||
|
Set out below is a summary of the audited financial information for the joint venture AttAfrica. |
||||||||||||||||||||||||||||||||||||||||||||||||||||||||||||||||||||||||||||||||||||||||||||||||||||||||||||||||||||||||||||||||||||||||||||||||||||||||||||
|
||||||||||||||||||||||||||||||||||||||||||||||||||||||||||||||||||||||||||||||||||||||||||||||||||||||||||||||||||||||||||||||||||||||||||||||||||||||||||||
| E6 | FINANCIAL ASSET | |||||||||||||||||||||||||||||||||||||||||||||||||||||||||||||||||||||||||||||||||||||||||||||||||||||||||||||||||||||||||||||||||||||||||||||||||||||||||||
| E6.1 | Accounting policy | |||||||||||||||||||||||||||||||||||||||||||||||||||||||||||||||||||||||||||||||||||||||||||||||||||||||||||||||||||||||||||||||||||||||||||||||||||||||||||
|
Where the Group has a contractual right to receive its share of net distributable earnings of a financial asset, the financial asset is designated at fair value through profit or loss (FVTPL) and initially measured at fair value. Subsequent to initial recognition, the financial asset is measured at fair value and changes in the fair value are recognised in the consolidated statement of profit or loss and other comprehensive income. Any gain or loss on initial recognition (i.e. the difference between the fair value and the amount paid) is deferred where the valuation method used to determine the fair value includes assumptions which are derived from unobservable inputs. The deferred profit or loss is subsequently recognised in profit or loss only to the extent of a change in a factor (including time) that market participants would take into account when pricing the asset. |
||||||||||||||||||||||||||||||||||||||||||||||||||||||||||||||||||||||||||||||||||||||||||||||||||||||||||||||||||||||||||||||||||||||||||||||||||||||||||||
| E6.2 | Key judgements and estimations | |||||||||||||||||||||||||||||||||||||||||||||||||||||||||||||||||||||||||||||||||||||||||||||||||||||||||||||||||||||||||||||||||||||||||||||||||||||||||||
|
The key judgements and estimations which have an effect on the Group's investment in Hystead (which is classified as a financial asset) are set out below:
|
||||||||||||||||||||||||||||||||||||||||||||||||||||||||||||||||||||||||||||||||||||||||||||||||||||||||||||||||||||||||||||||||||||||||||||||||||||||||||||
| E6.3 | Profile | |||||||||||||||||||||||||||||||||||||||||||||||||||||||||||||||||||||||||||||||||||||||||||||||||||||||||||||||||||||||||||||||||||||||||||||||||||||||||||
 |
||||||||||||||||||||||||||||||||||||||||||||||||||||||||||||||||||||||||||||||||||||||||||||||||||||||||||||||||||||||||||||||||||||||||||||||||||||||||||||
| E6.4 | Carrying value and net movement for the year | |||||||||||||||||||||||||||||||||||||||||||||||||||||||||||||||||||||||||||||||||||||||||||||||||||||||||||||||||||||||||||||||||||||||||||||||||||||||||||
|
||||||||||||||||||||||||||||||||||||||||||||||||||||||||||||||||||||||||||||||||||||||||||||||||||||||||||||||||||||||||||||||||||||||||||||||||||||||||||||
| E6.5 | Gross movement for the year | |||||||||||||||||||||||||||||||||||||||||||||||||||||||||||||||||||||||||||||||||||||||||||||||||||||||||||||||||||||||||||||||||||||||||||||||||||||||||||
| Group and Company | |||||
| June 2020 R'000 |
June 2019 R'000 |
||||
|---|---|---|---|---|---|
| E6.5.1 | Gross asset (A) | ||||
| Balance at the beginning of the year | 4 504 991 | 3 891 691 | |||
| Unrealised foreign exchange movement | 933 815 | 25 558 | |||
| Fair value adjustment through profit or loss | 189 164 | 587 742 | |||
| Subtotal (fair value) at the end of the year | 5 627 970 | 4 504 991 | |||
| New guarantees issued | – | 110 401 | |||
| Fair value adjustment through profit or loss | – | (110 401) | |||
| Balance at the end of the year | 5 627 970 | 4 504 991 | |||
| E6.5.2 | Deferred gains (B) | ||||
| Balance at the beginning of the year | (4 286 547) | (3 770 115) | |||
| Unrealised foreign exchange movement | (888 535) | (24 760) | |||
| Fair value adjustment through profit or loss | 80 084 | (491 672) | |||
| Balance at the end of the year | (5 094 998) | (4 286 547) | |||
| E6.5.3 | Fair value of financial asset (A-B) | 532 972 | 218 444 | ||
| Balance at the end of the year | 532 972 | 218 444 | |||
| E6.6 | Movements through profit or loss | ||||
| Movement on financial asset | 1 122 979 | 613 300 | |||
| Movement on deferred gains on financial asset | (808 451) | (516 432) | |||
| Net movements on financial asset before guarantees | 314 528 | 96 868 | |||
| Less: Capital investments | – | (71 696) | |||
| Less: New guarantees issued | – | (110 401) | |||
| Total fair value adjustment to financial asset | 314 528 | (85 229) | |||
| E6.7 | Valuation methodology | ||||||||||||||||||||||||||||||||||||||||||||||||||||||||||||||||||||||||||||||
|
The Group performs an internal valuation of the financial asset based on the cash flows of the underlying investment property companies. The European investment properties are independently valued each December. The following tables show the valuation techniques used in measuring the financial asset, as well as the significant unobservable inputs used:
|
|||||||||||||||||||||||||||||||||||||||||||||||||||||||||||||||||||||||||||||||
| E6.8 | Valuation assumptions | ||||||||||||||||||||||||||||||||||||||||||||||||||||||||||||||||||||||||||||||
|
The key assumptions used in determining the fair value of the investment in Hystead are in the following ranges:
|
|||||||||||||||||||||||||||||||||||||||||||||||||||||||||||||||||||||||||||||||
| E6.9 | Valuation sensitivity | ||||||||||||||||||||||||||||||||||||||||||||||||||||||||||||||||||||||||||||||
|
The valuation of the investment in Hystead is sensitive to changes to the unobservable inputs. Changes to one of the unobservable inputs, while holding the other inputs constant, would have the following effects on the fair value of the investment in Hystead in the statement of profit or loss.
|
|||||||||||||||||||||||||||||||||||||||||||||||||||||||||||||||||||||||||||||||
| E7 | ASSETS AND LIABILITIES HELD-FOR-SALE | ||||||||||||||||||||||||||||||||||||||||||||||||||||||||||||||||||||||||||||||
| E7.1 | Accounting policy | ||||||||||||||||||||||||||||||||||||||||||||||||||||||||||||||||||||||||||||||
|
Non-current assets, or disposal groups comprising assets and liabilities, that are expected to be recovered primarily through sale rather than through continuing use, are classified as held-for-sale. This condition is regarded as met only when the sale is highly probable and the non-current asset or disposal group is available for sale in its present condition subject only to terms that are usual and customary for sales of such assets. For the sale to be highly probable, the appropriate level of management must be committed to a plan to sell the asset or disposal group. Investment property classified as held-for-sale is measured in accordance with IAS 40: Investment property at fair value with gains or losses on subsequent disposal being recognised in profit or loss in the line profit/(loss) on disposal – investment property. Disposal groups and non-current assets held-for-sale are presented separately from other assets and liabilities in the statement of financial position. |
|||||||||||||||||||||||||||||||||||||||||||||||||||||||||||||||||||||||||||||||
| E7.2 | Summary of disposal group | ||||||||||||||||||||||||||||||||||||||||||||||||||||||||||||||||||||||||||||||
|
In 2019 the Group reviewed its strategy, resulting in a revised three-year strategic plan. This led to a decision to exit the Group's sub-Saharan African investments. As a result the Group's interest in Gruppo (which owns 100% of the Ikeja City Mall in Lagos, Nigeria, and in which Hyprop has a 75% interest) was designated as held-for-sale. Gruppo is reported under the sub-Saharan African operating segment. Subsequent to 30 June 2020, key terms have been agreed for the disposal of Ikeja City Mall based on a valuation of $115 million. See note O2.2 for details. The carrying values of the assets and liabilities of Gruppo have been adjusted in line with the anticipated sale proceeds. The Group's other sub-Saharan African interests comprise its investments and loans receivable from AttAfrica. It is anticipated that these interests will be realised by repayment of the loans receivable from the proceeds on disposal of the underlying investment properties. The loans receivable have been classified as short-term and are included in current assets. |
|||||||||||||||||||||||||||||||||||||||||||||||||||||||||||||||||||||||||||||||
| E7.3 | Maturity profile | ||||||||||||||||||||||||||||||||||||||||||||||||||||||||||||||||||||||||||||||
| Group | Company | ||||||||
| June 2020 R'000 |
June 2019 R'000 |
June 2020 R'000 |
June 2019 R'000 |
||||||
|---|---|---|---|---|---|---|---|---|---|
| Non-current assets | 2 009 115 | 1 985 653 | – | – | |||||
| Current assets | 89 803 | 62 194 | – | – | |||||
| Total assets classified as held-for-sale less costs to sell | 2 098 918 | 2 047 847 | – | – | |||||
| Borrowings – current liabilities (2019: non-current) | (1 312 286) | (1 056 562) | – | – | |||||
| Other – current liabilities | (46 930) | (41 738) | – | – | |||||
| Total liabilities associated with assets held-for-sale | (1 359 216) | (1 098 300) | – | – | |||||
| Net assets classified as held-for-sale | 739 702 | 949 547 | – | – | |||||
| E7.4 | Movement for the year – assets | ||||||||
| Balance at the beginning of the year | 2 047 847 | 199 257 | – | 199 257 | |||||
| Disposals – Lakefield office park | – | (199 257) | – | (199 257) | |||||
| Additions – Gruppo | 51 071 | 2 047 847 | – | – | |||||
| Balance at the end of the year | 2 098 918 | 2 047 847 | – | – | |||||
| E7.5 | Movement for the year – liabilities | ||||||||
| Balance at the beginning of the year | (1 098 300) | (8 157) | – | (8 157) | |||||
| Disposals – Lakefield office park | – | 8 157 | – | 8 157 | |||||
| Additions – Gruppo | (260 916) | (1 098 300) | – | – | |||||
| Balance at the end of the year | (1 359 216) | (1 098 300) | – | – | |||||
| Net assets classified as held-for-sale | 739 702 | 949 547 | – | – | |||||