


 115 / 156

8.
Other investment
continued
GROUP
June 2015
R000
GROUP
June 2014
R000
COMPANY
June 2015
R000
COMPANY
June 2014
R000
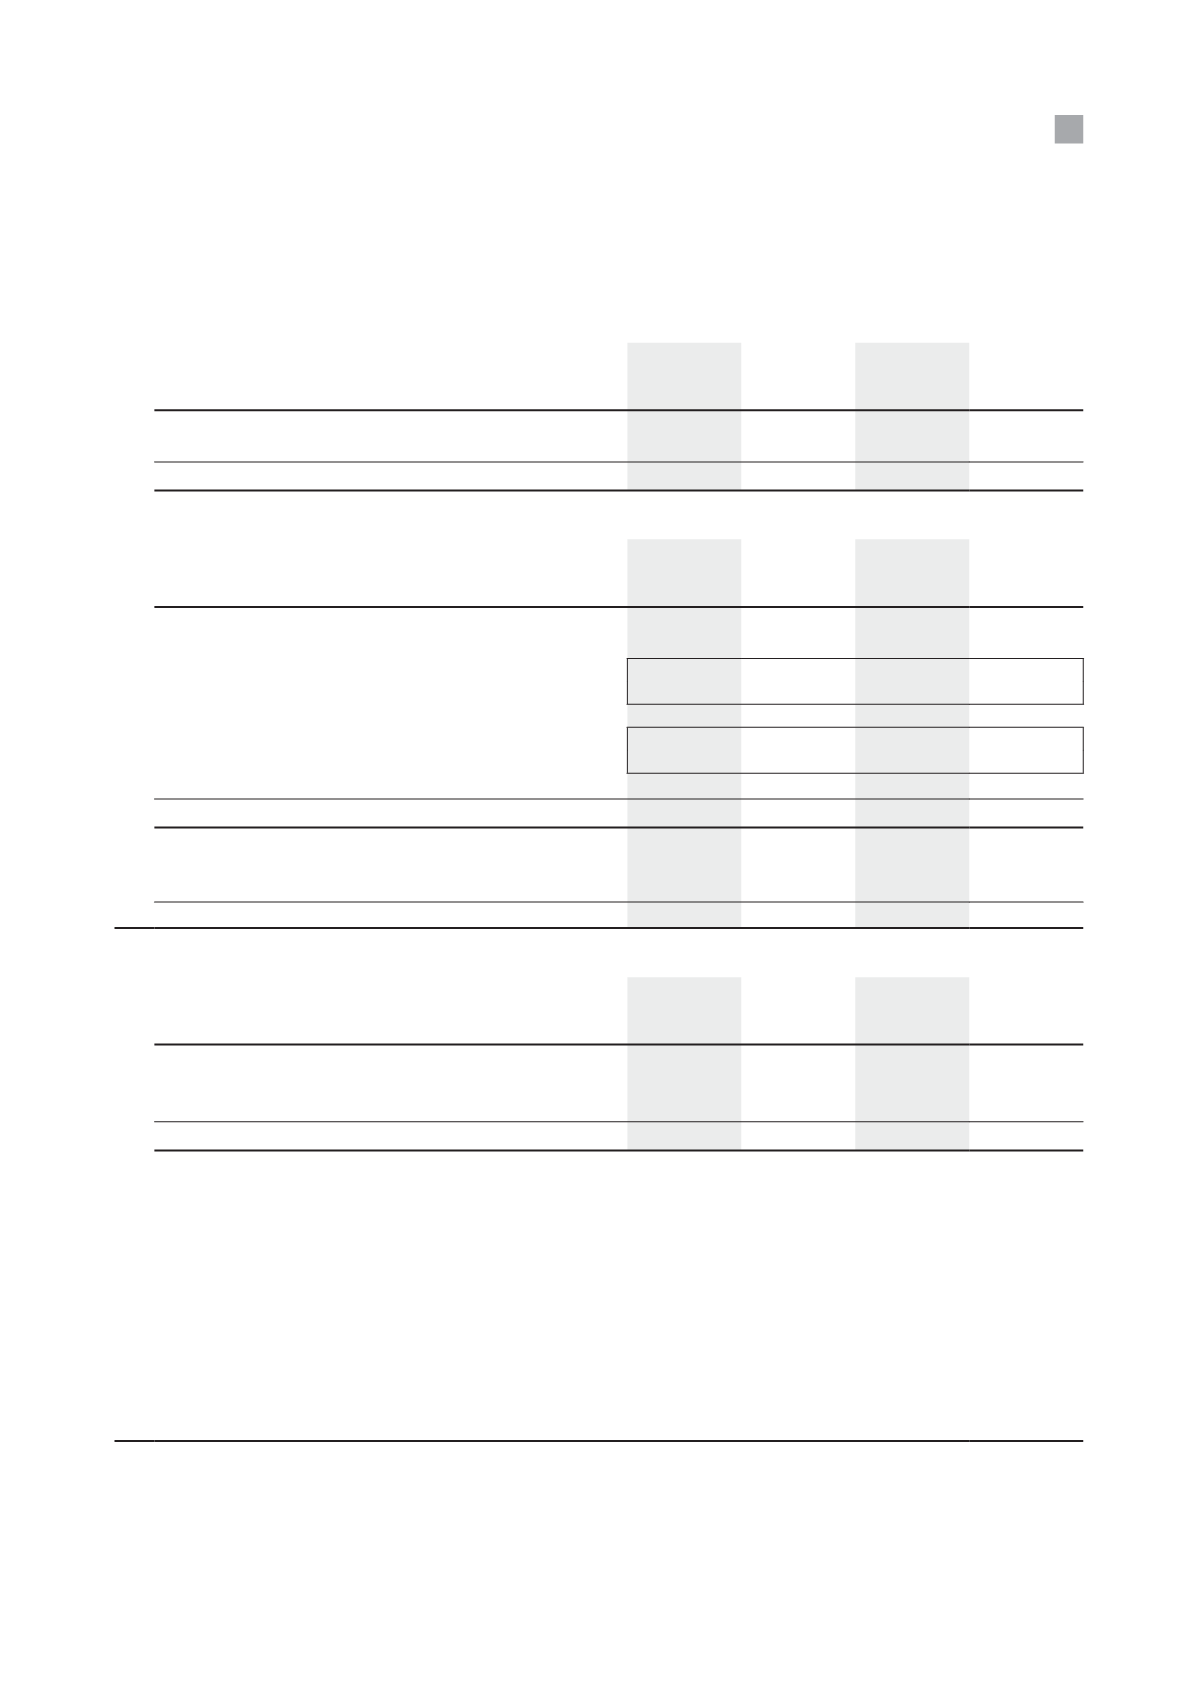
Balance at beginning of year
Acquired during the year
#
#
Balance at end of year
#
#
#
Amount less than R 1 000
No impairment was recognised during the current year.
GROUP
June 2015
R000
GROUP
June 2014
R000
COMPANY
June 2015
R000
COMPANY
June 2014
R000
Statement of financial position – AttAfrica SA
Total assets
474
Non-current assets
95
Current assets
379
Total liabilities
244
Non-current liabilities
Current liabilities
244
Net assets
230
Group’s share of net assets of AttAfrica SA
86
Statement of comprehensive income – AttAfrica SA
Total revenue
5 233
Total profit for the year
229
Group’s share of profits of AttAfrica SA
86
9.
Goodwill
GROUP
June 2015
R000
GROUP
June 2014
R000
COMPANY
June 2015
R000
COMPANY
June 2014
R000
Goodwill arising on acquisition
Word4Word
4 280
12 059
Impairment – current year
(4 280)
(7 779)
Balance
4 280
The group tests goodwill for impairments annually.
The recoverable amount of goodwill was determined based on its value in use by using the discounted cash flow method over
three years.
Q
Budgets and forecasts were prepared by management of Word4Word.
Q
Due to changes in the operational structure of Word4Word and the loss of key contracts, its expenses exceed its income.
Therefore it is estimated that the company may incur losses in the foreseeable future.
Q
Impairment testing, taking into account these developments, resulted in the further reduction of goodwill in 2015 to a recoverable
amount of nil.
Q
Management is not currently aware of any probable changes that would necessitate changes in the key estimates.
Key assumptions used during this valuation process:
Q
Income decreased between 7% and 10% (2014 increased: 5%).
Q
Expenses increased between 6% and 7% (2014: 5%).
Q
Future cash flows were discounted at 18% (2014: 18%) which is a comparable rate for companies of this nature.
113
Hyprop Investments Limited
Integrated Report 2015