


 40 / 156

OPERATIONAL REVIEW
PROPERTY PORTFOLIO – SOUTH AFRICA
continued
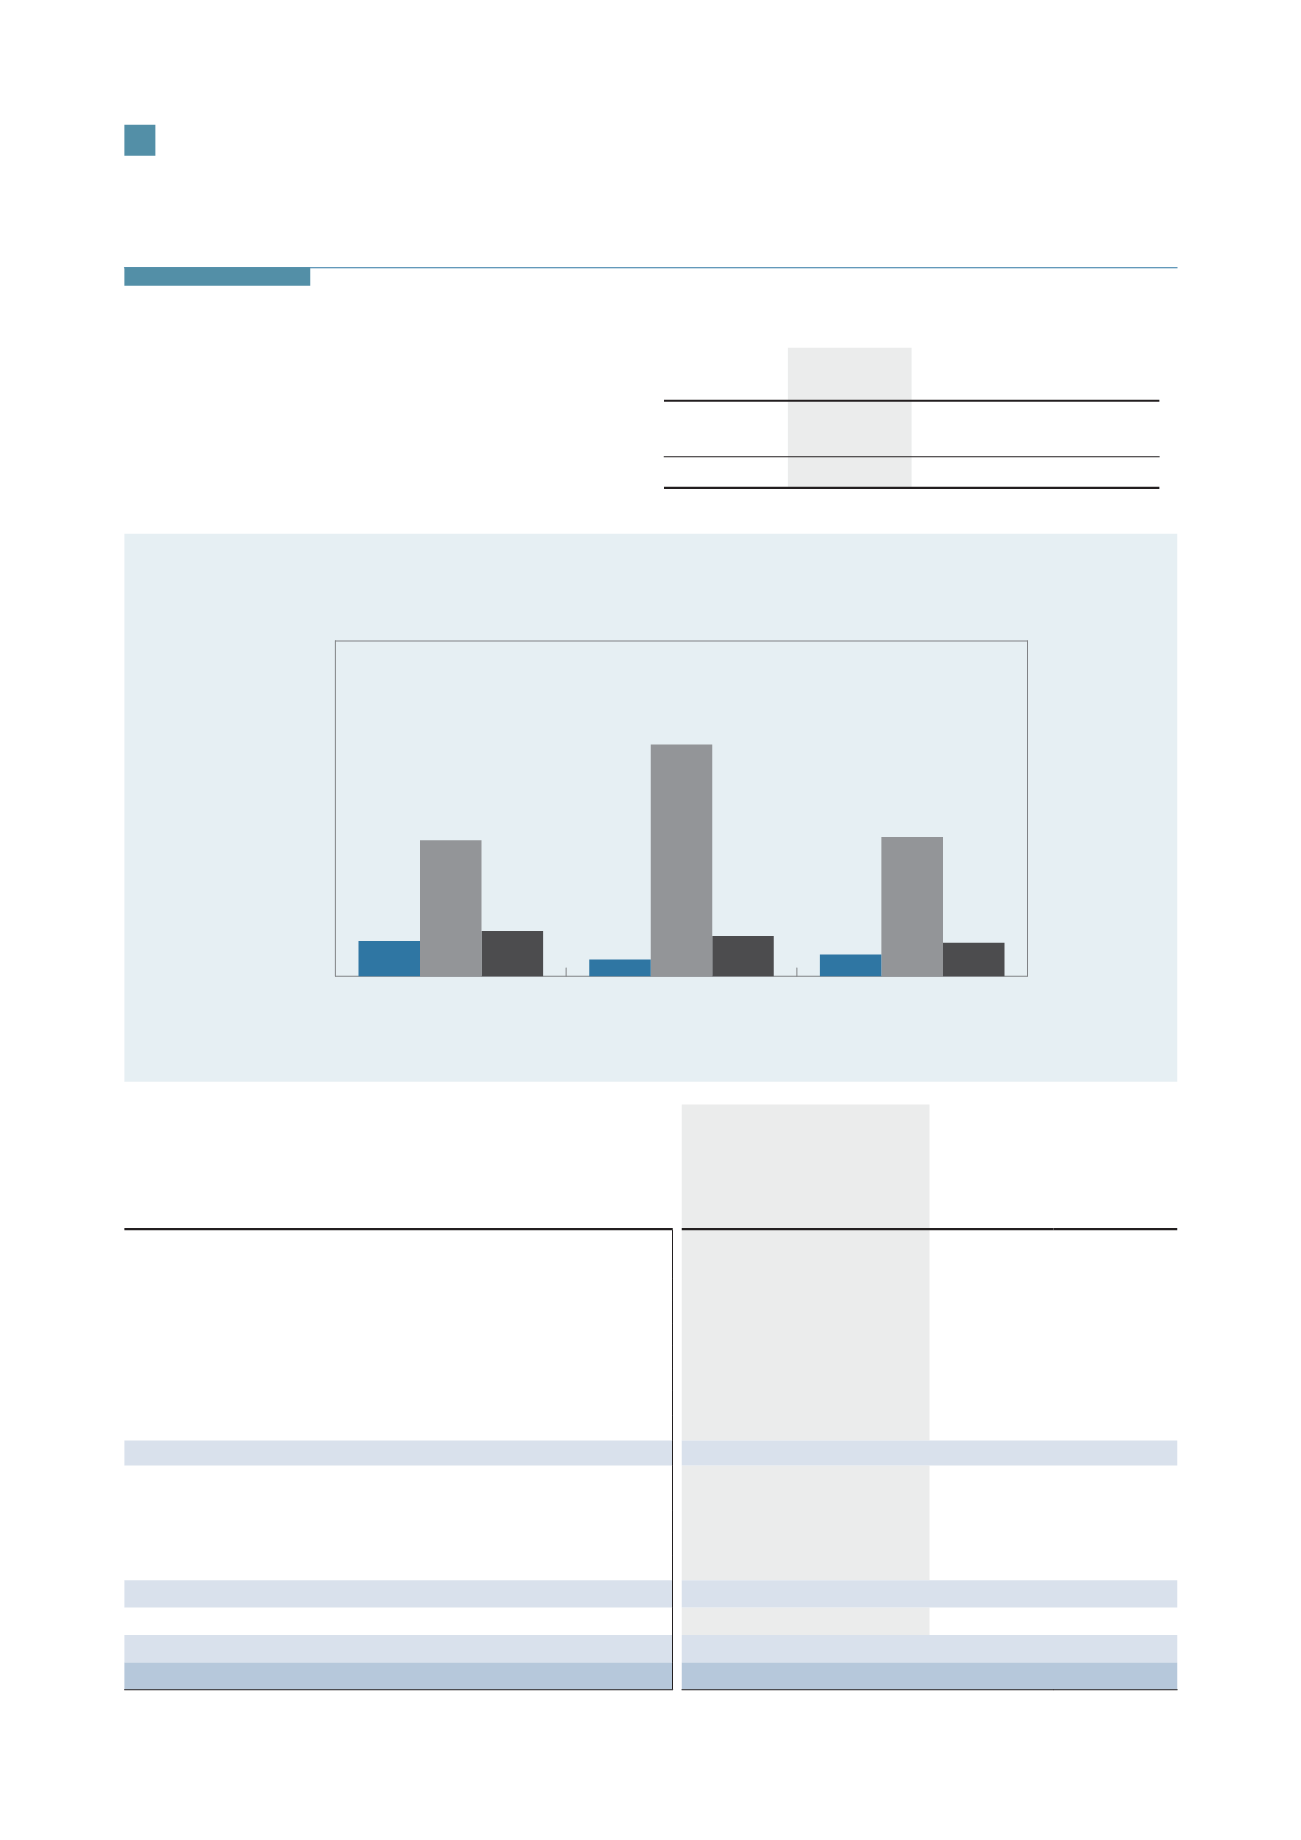
Vacancy profile
Vacancies in the retail portfolio (including Rosebank Mall) increased
marginally to 1,3% (2014: 1,2%). Vacancies in the office portfolio (9,7% of the
total portfolio by rentable area) reduced to 8,3% (2014: 13,8%), mainly due
to new lettings at Lakefield Office Park and Canal Walk offices.
Vacancies
30 June 2015
%
30 June 2014
%
30 June 2013
%
Retail
1,3
1,2*
2,1*
Offices
8,3
13,8
8,1
Total
2,0
2,4
2,7
* Excludes Rosebank Mall
0
5
10
15
20
Vacancies by rentable area
30 June 2013
30 June 2014
30 June 2015
2,1%
8,1%
2,7%
1,2%
13,8%
2,4%
1,3%
8,3%
2,0%
Q
Retail
Q
Offices
Q
Total
30 June 2015
June 2014
Vacancies
Total area
available
for leasing
m
2
Rentable
area
%
Total area
available
for leasing
m
2
Rentable
area
%
RETAIL
Canal Walk
1 368
0,9
1 089
0,7
Clearwater Mall
0
0,0
18
0,0
The Glen
964
1,2
496
0,6
Woodlands
0
0,0
0
0,0
Somerset Mall
1 087
1,6
2 148
3,2
CapeGate
902
1,4
420
0,7
Rosebank
827
1,3
Hyde Park Corner
329
1,2
0
0,0
Shopping centres
5 477
0,9
4 171
0,8
Stoneridge
Sold
Sold
1 711
3,5
Atterbury Value Mart
0
0,0
0
0,0
Willowbridge
1 674
4,2
199
0,5
CapeGate Lifestyle
Sold
Sold
2 406
7,4
Somerset Value Mart
1 987
15,8
130
1,0
Value centres
3 661
3,7
4 446
2,4
Total
9 138
1,3
8 617
1,2
Offices total*
6 247
8,3
10 755
13,8
Grand total
15 385
2,0
19 372
2,4
*
Includes offices in shopping centres and standalone offices
38
Hyprop Investments Limited
Integrated Report 2015