


 22 / 148

20
Hyprop Investments Limited
Integrated annual report and consolidated financial statements
2017
Financial director’s
report
Whilst income growth from the core South African portfolio has moderated in recent years, the South African shopping centres are still defensive in a low
growth economy, and dominate their catchment areas. The investments in South-Eastern Europe are becoming a more significant contributor to total
distribution growth for Hyprop.
South African portfolio
Revenue and distributable earnings
In the year under review, distributable earnings from the South African portfolio constituted 90,8% (2016: 93,3%) of total distributable earnings (before the
deduction of fund management expenses and net interest).
12 months ended
30 June 2017
12 months ended
30 June 2016
Business segment
Revenue
R000
Distributable
earnings
R000
Revenue
R000
Distributable
earnings
R000
Shopping centres
2 580 200
1 723 648
2 413 365
1 633 312
Value centres
(1)
174 314
128 615
161 017
114 046
Total retail
2 754 514
1 852 263
2 574 382
1 747 358
Standalone offices
(2)
46 908
28 332
41 701
25 828
Investment property (excluding properties sold)
2 801 422
1 880 595
2 616 083
1 773 186
Properties sold
(3)
74 179
36 332
128 611
74 965
Total investment property
2 875 601
1 916 927
2 744 694
1 848 151
(1)
Includes Willowbridge North (held-for-sale)
(2)
Includes Lakefield Office Park (held-for-sale)
(3)
Properties sold during the 2017 year include Somerset Value Mart, Willowbridge South, Glenfield and Glenwood office parks
Revenue and distributable earnings from investment property in the South African portfolio (excluding properties sold) increased by 7,1% and 6,1%,
respectively.
Clearwater Mall, Hyde Park Corner, CapeGate and Somerset Mall performed well during the year, with weighted average growth in distributable earnings
of 8,6%. The Glen’s income was affected by construction work and limited rent reductions.
Cost-to-income ratios
In line with industry best practice, the cost-to-income ratios are presented on a gross and net basis.
30 June
2017
30 June
2016
Gross basis (%)
33,3
33,2
Net basis (%)
15,7
15,0
The cost-to-income ratios increased marginally, due in part to higher municipal costs at Canal Walk and loss of income due to extensions and refurbishments
at The Glen, Rosebank Mall and Canal Walk.
Hyprop declared a
dividend of 695,1 cents
per share for the year
ended 30 June 2017, an
increase of 12,1% on the
prior year, maintaining
distribution growth
above the sector average
in a tough trading
environment
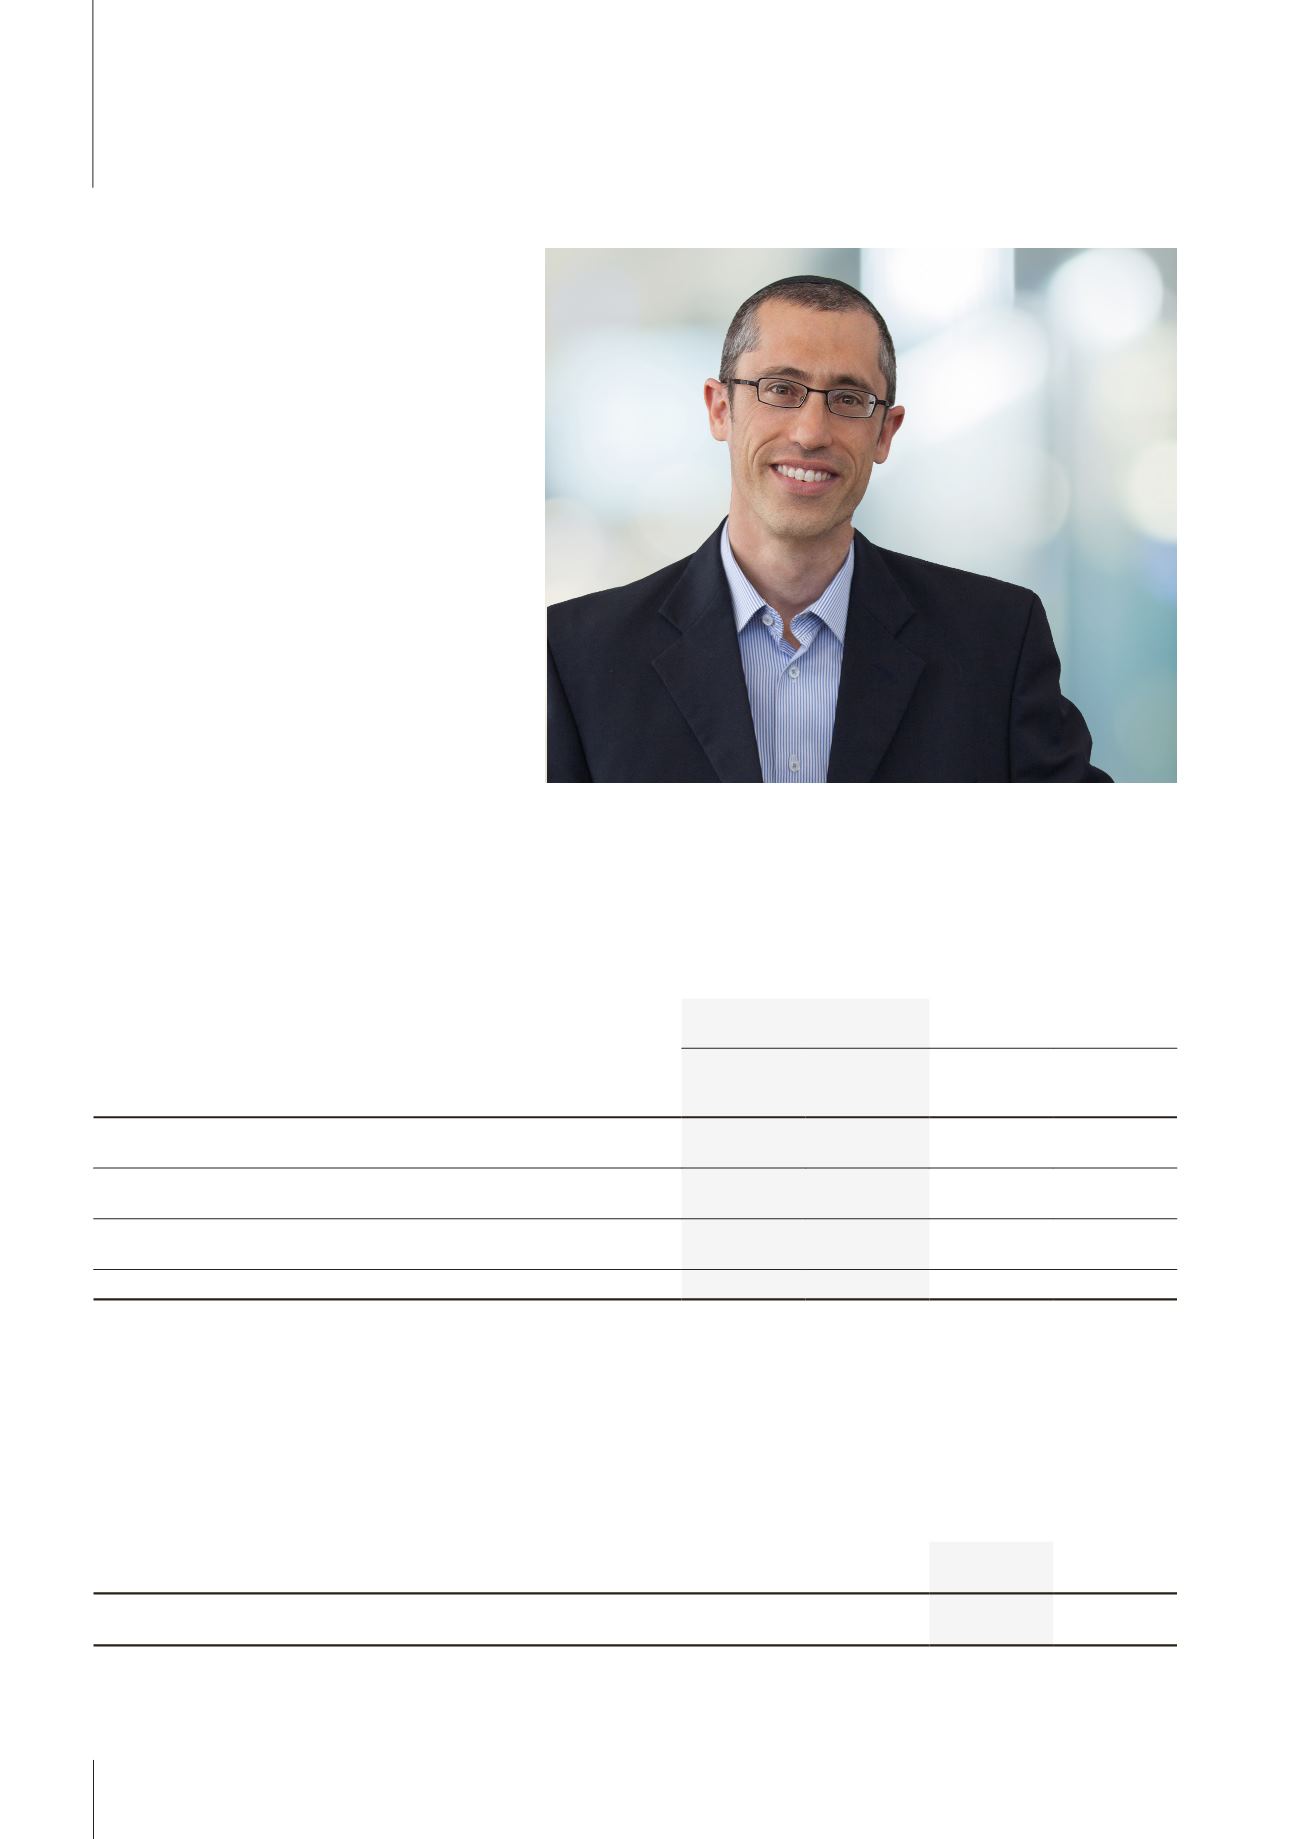
Laurence Cohen, Financial director