


 14 / 156

2015 IN PERSPECTIVE
FINANCIAL DIRECTOR’S REPORT
Distributable earnings statement
12 months ended
12 months ended
30 June 2015
30 June 2014
Business segment
Revenue
R000
Distributable
earnings
R000
Revenue
R000
Distributable
earnings
R000
Canal Walk (80%)
579 188
412 308
545 252
379 254
Clearwater Mall
358 011
245 039
336 499
224 585
Rosebank Mall
234 353
149 665
121 808
63 302
Woodlands Boulevard
231 701
152 821
214 842
142 336
Somerset Mall
231 100
159 387
166 624
116 017
The Glen (75,15%)
218 999
153 796
214 218
143 198
Hyde Park Corner
199 074
130 900
179 905
120 000
CapeGate
167 562
96 472
157 166
91 674
Shopping centres
2 219 988
1 500 388
1 936 314
1 280 366
Atterbury Value Mart
120 286
89 544
112 551
83 714
Willowbridge
1
90 746
49 793
85 797
46 232
Somerset Value Mart
23 784
1
15 308
1
22 692
14 466
Value centres
234 816
154 645
221 040
144 412
Stoneridge
2
(90%)
56 275
29 110
67 864
31 042
CapeGate Lifestyle
2
32 937
22 178
46 380
31 721
Properties sold
89 212
51 288
114 244
62 763
Total retail
2 544 016
1 706 321
2 271 598
1 487 541
Standalone offices
3
73 126
45 866
67 900
42 159
Investment property
2 617 142
1 752 187
2 339 498
1 529 700
Investments in sub-Saharan Africa (excluding SA)
42 368
77 953
35 078
Listed property securities
4
37 265
37 265
Word4Word Marketing
25 807
4 243
15 008
3 180
Fund management expenses
(62 001)
(55 139)
Net interest
(417 178)
(401 484)
Straight-line rental income accrual
60 085
45 055
Total
2 703 034
1 319 619
2 514 779
1 148 600
1
Held for sale
2
Sold during the 2015 financial year
3
Includes Glenwood, Glenfield and Lakefield – held for sale
4
Sycom units – sold
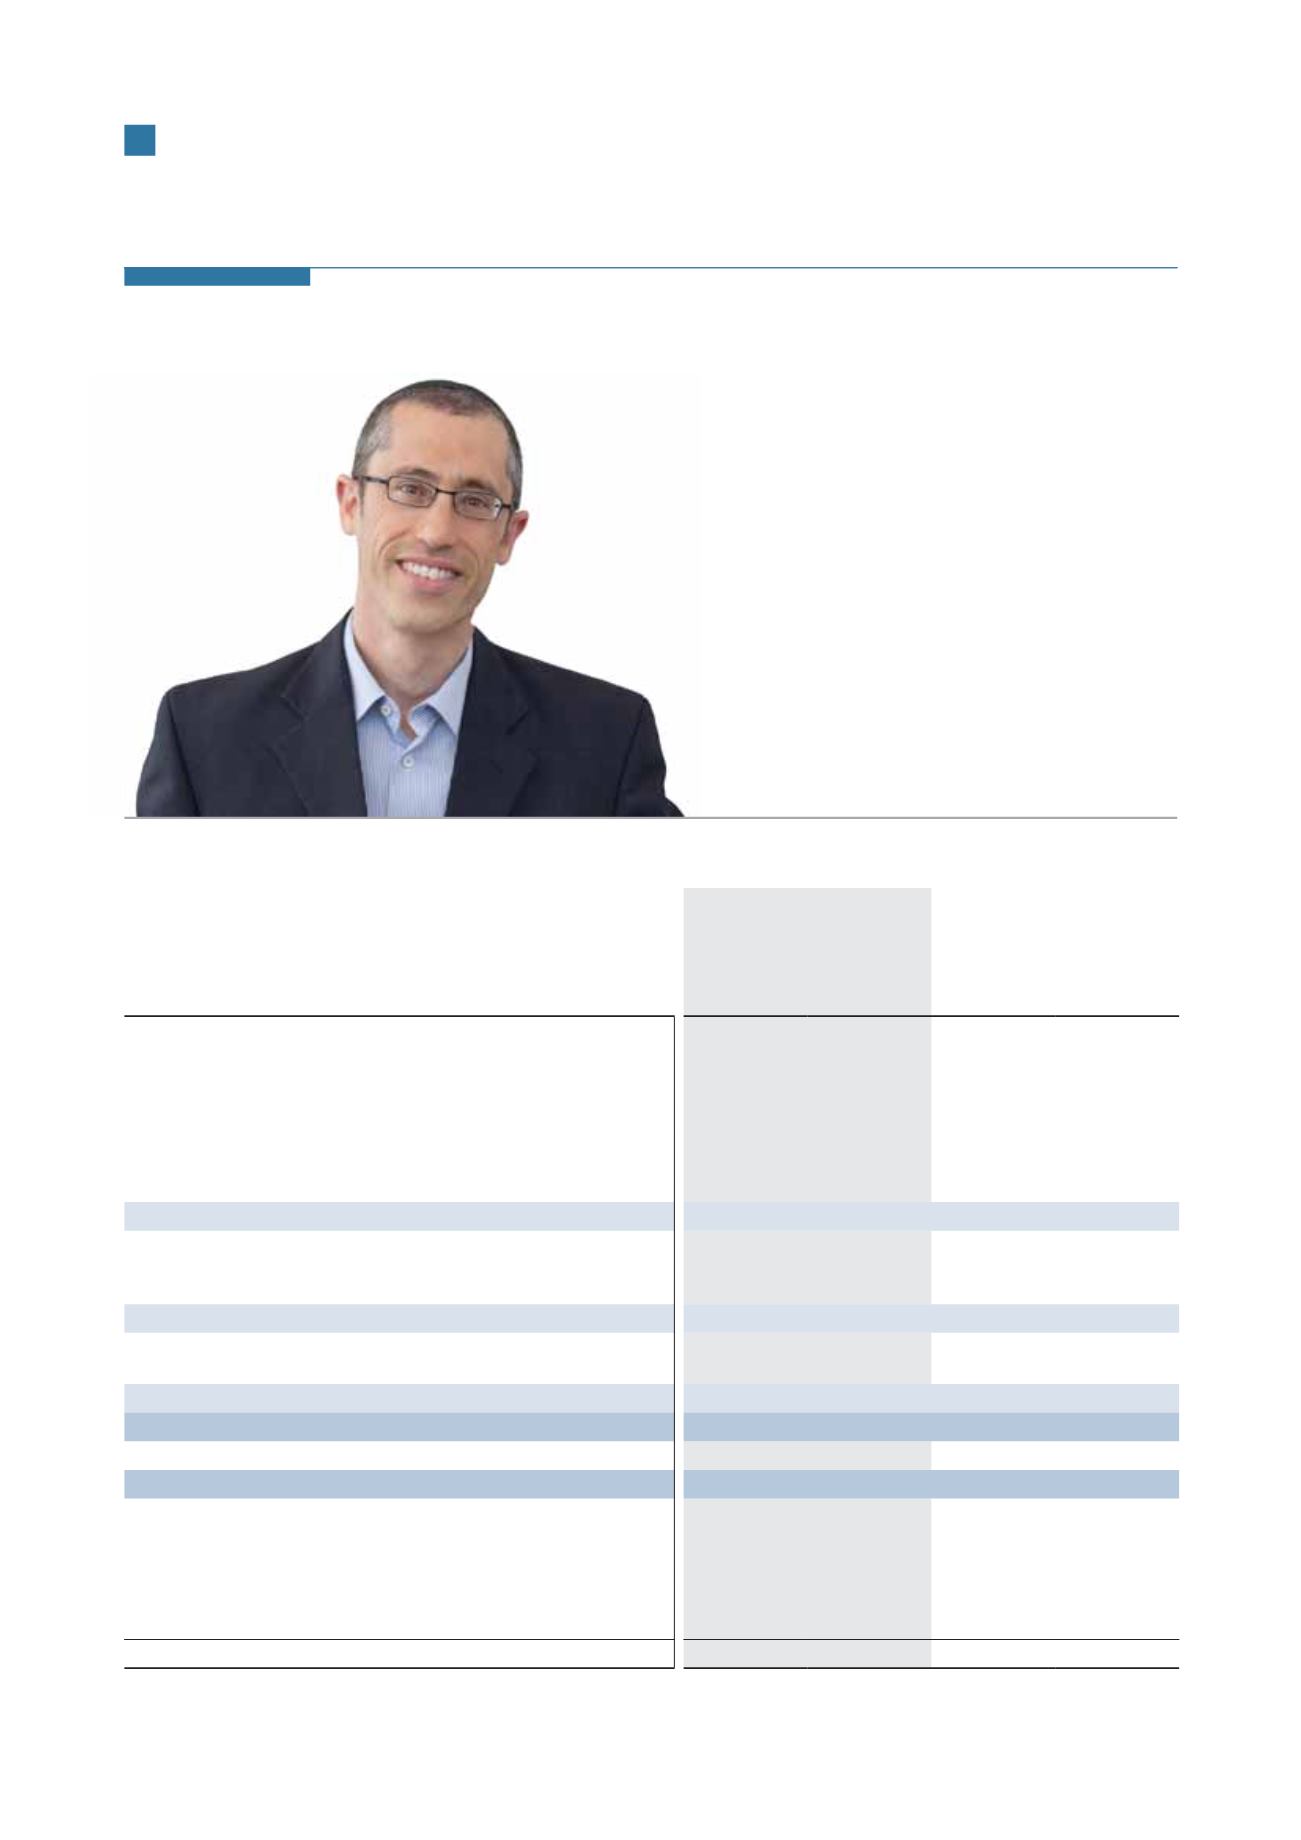
Laurence Cohen,
financial director
Hyprop declared a
dividend of 280,3 cents
per share for the six
months ended 30 June
2015, an increase of 16,3%
on the corresponding
period in 2014. The total
distribution for the year
of 543 cents per share
is 15,0% higher than the
prior period.
12
Hyprop Investments Limited
Integrated Report 2015