


 17 / 156

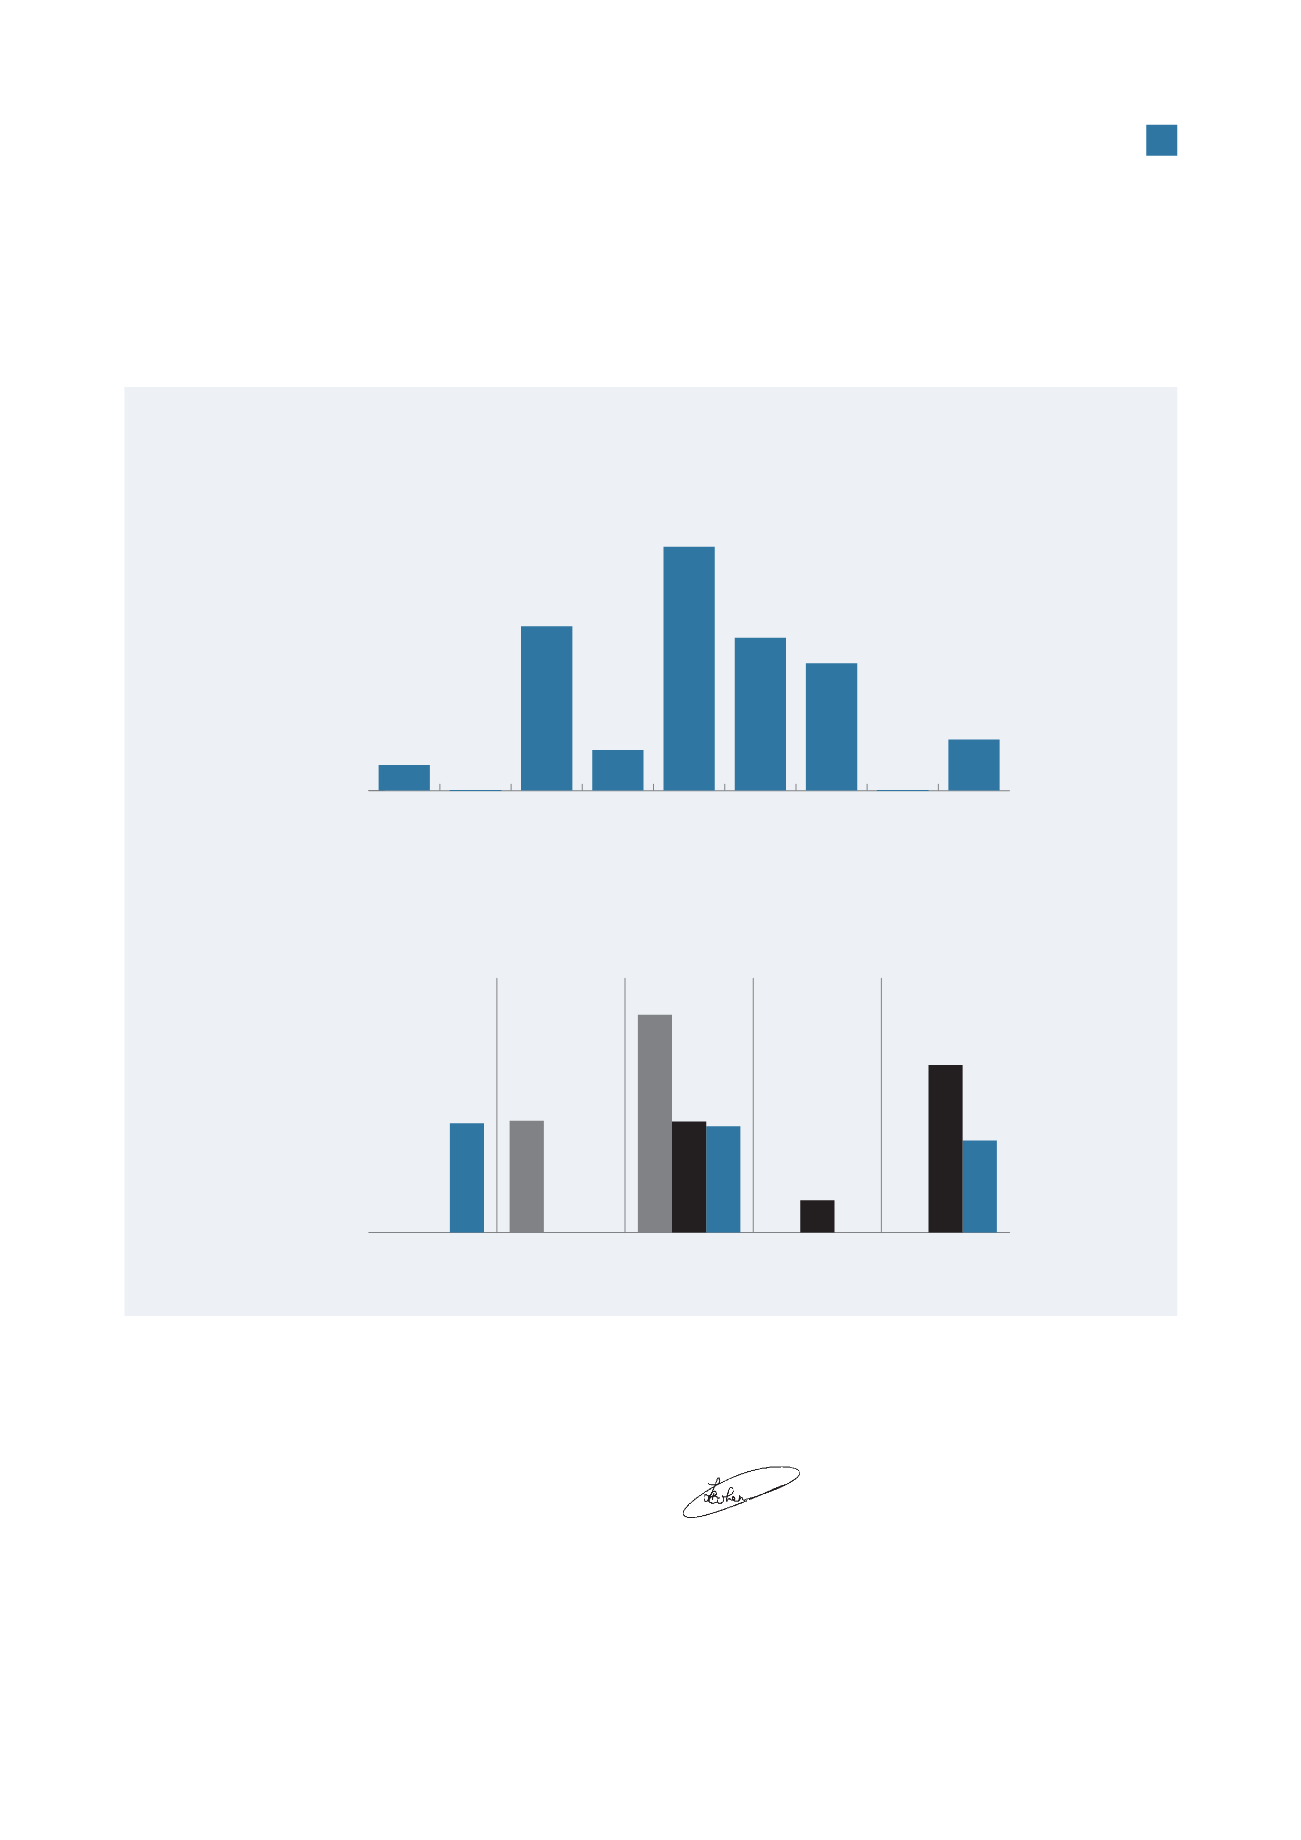
The maturity profile of Hyprop’s debt facilities, fixed rate agreements and interest rate swaps is reflected below:
0
500
1 000
1 500
2 000
Average maturity 5,2 years
Rm
Maturity profile
Fixed rates and swaps
June 2016 June 2017 June 2018 June 2019 June 2020 June 2021 June 2022 June 2023 June 2024
200
1 289
318
1 914
1 200
400
1 000
0
200
400
600
800
1 000
1 200
1 400
1 600
1 800
Average maturity 3,2 years
Debt maturity profile
Bank facilities and debt capital market funding
June 2016
June 2017
June 2018
June 2019
June 2020
772
789
783
1 538
750
650
1 184
227
Q
Bonds/commercial paper
Q
SA bank facilities
Q
USD bank facilities
Rm
Cash management
All rental income earned by the company, less property expenses and
interest on debt, is distributed to shareholders semi-annually.
Cash collected between distribution payments is paid into floating rate
debt facilities to benefit from the interest saving.
New developments and capital expenditure are funded with debt
while acquisitions, depending on their size, may be funded in part by
equity. Proceeds from the sale of non-core assets will be applied to
capital expenditure, developments and the reduction of debt.
Appreciation
I thank the finance team for their dedication, commitment and hard
work during the year. I also extend my appreciation to my fellow board
members for their sound advice and valued guidance.
Laurence Cohen
Financial director
15
Hyprop Investments Limited
Integrated Report 2015