


 19 / 156

2015 IN PERSPECTIVE
VALUE ADDED STATEMENT
for the year ended 30 June 2015
Value added is a measure of the wealth created by the group and its employees through its various business activities. This statement
shows the value added and how it was shared.
Unaudited
12 months to
June 2015
Rm
%
Unaudited
12 months to
June 2014
Rm
%
Investment property income
2 643
2 432
Listed property securities income
37
Property expenses excluding employee remuneration and
municipal charges
(285)
(211)
Other operating expenses
(62)
(82)
Dividends received
47
35
Total value created
2 343
2 211
Value distributed
To employees
Remuneration and benefits
124
5
167
8
To providers of finance
Finance costs
352
15
401
18
To government
Current taxation
12
1
Municipal charges
535
23
496
22
To providers of capital
Distributions to shareholders (2014: unitholders)
1 320
56
1 147
52
Total value added
2 343
2 211
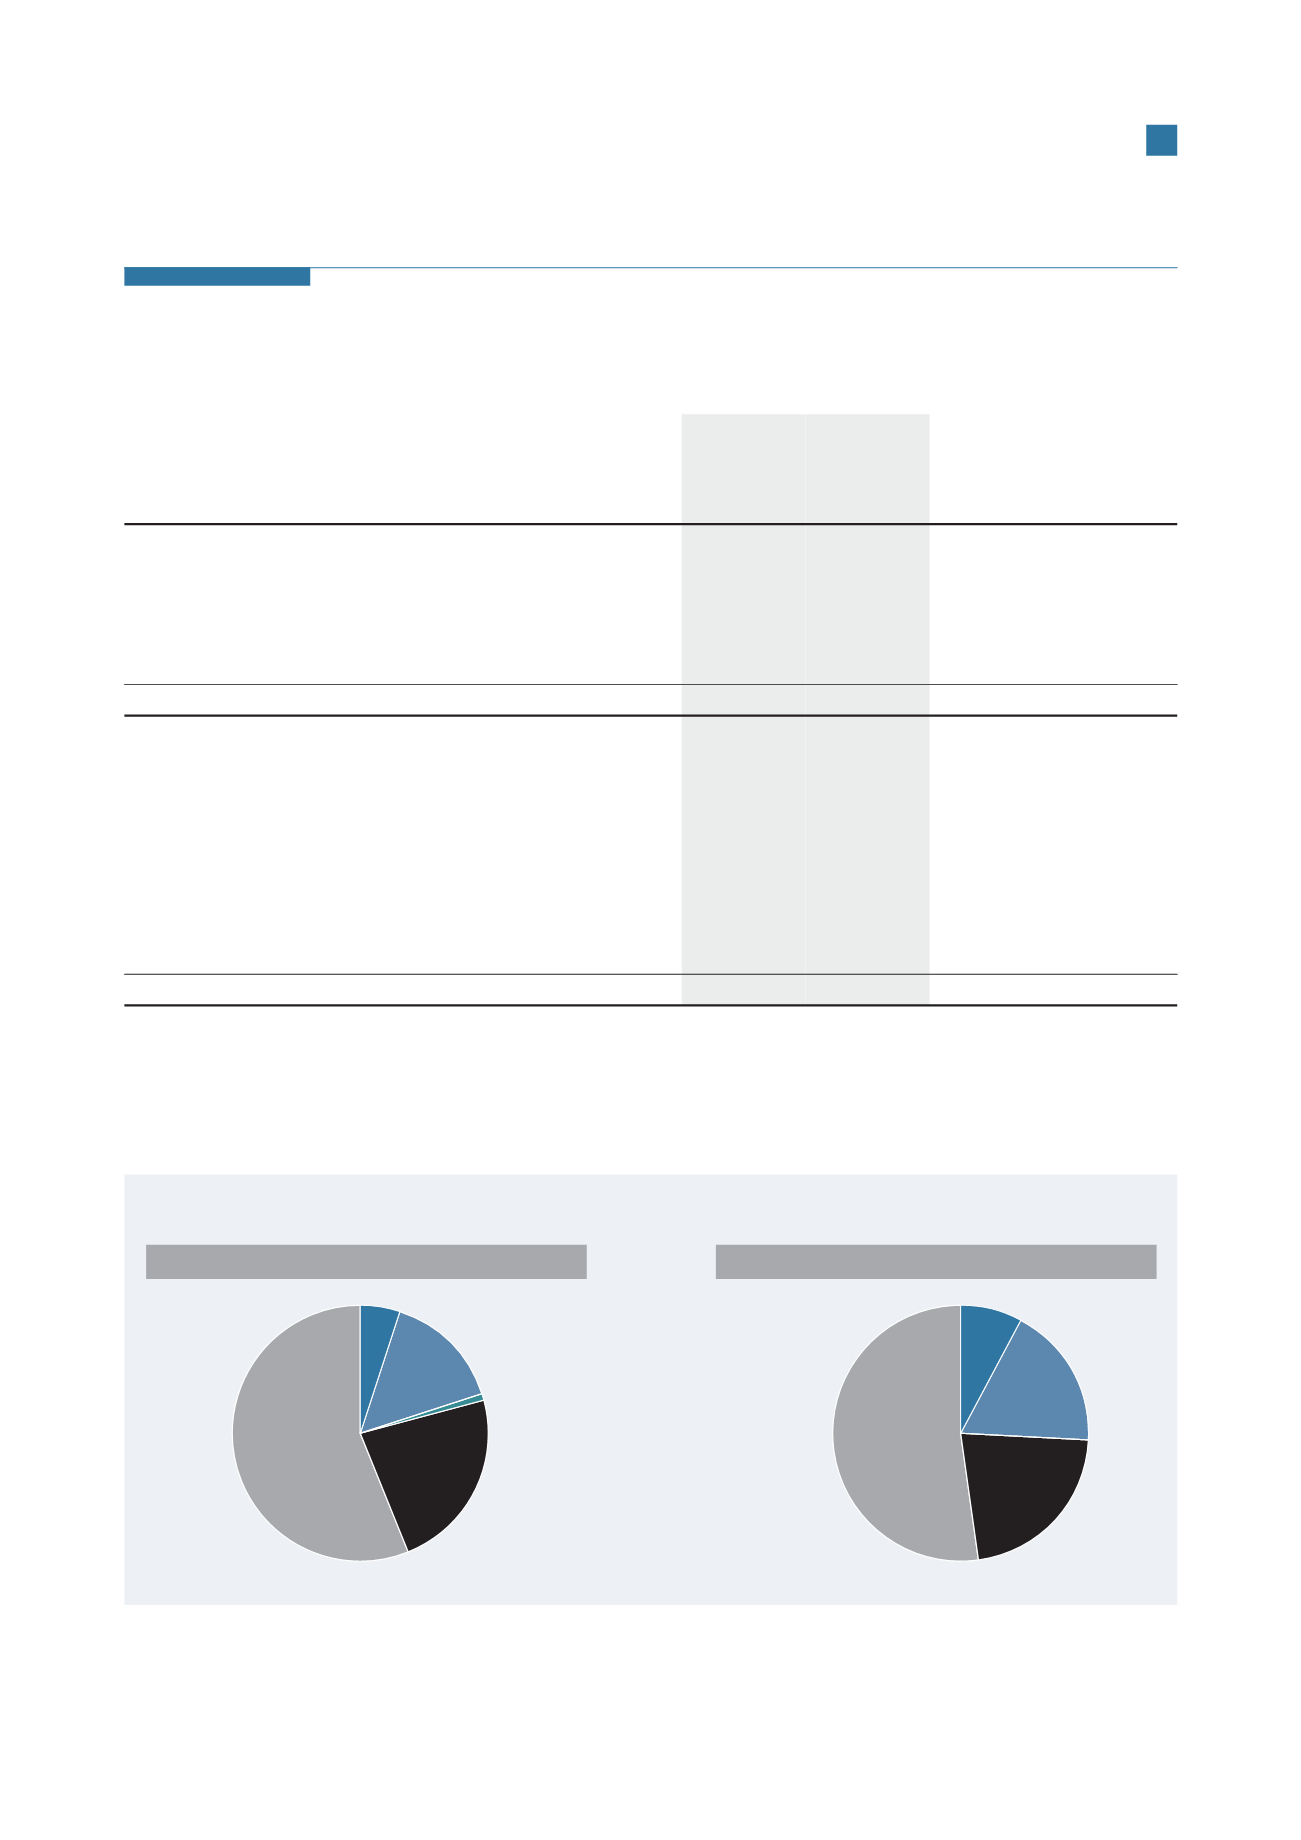
1%
52%
22%
8%
18%
15%
23%
56%
5%
12 months to June 2015
12 months to June 2014
Value distribution
O
Remuneration and benefits
O
Finance cost
O
Current taxation
O
Municipal charges
O
Distributions to
shareholders
(2014: unitholders)
17
Hyprop Investments Limited
Integrated Report 2015