


 49 / 156

Employment equity and transformation
We are committed to promoting equal opportunity and fair treatment by eliminating discrimination and implementing measures to redress
disadvantages experienced by designated groups and to ensure their equitable representation in all occupational categories.
Hyprop’s five-year employment equity plan was approved by the Department of Labour in 2013. An annual progress report is submitted in January each
year. Hyprop complies with the Employment Equity Act and is committed to ongoing organisational transformation to diversify its workforce.
Our challenge is that the current workforce is not growing, and due to extremely low staff turnover, very few vacancies become available.
Employment details
2015
Occupational levels (%)
Male
Female
Foreign
nationals
Total
Total
A
C
I
W
A
C
I
W Male Female
A
C
I
W
Top management
0,49 0,00 0,00 2,94 0,00 0,00 0,00 0,49 0,49 0,00 4,41
0,49 0,00 0,00 3,92
Senior management
0,49 0,00 0,49 2,94 0,00 0,00 0,00 6,37 0,00 0,00 10,29 0,49 0,00 0,49 9,31
Professionally qualified and experienced specialists and
mid-management
2,94 0,00 1,47 6,86 0,98 0,00 0,98 6,86 0,00 0,00 20,10 3,92 0,00 2,45 13,73
Skilled technical and academically qualified workers,
junior management, supervisors, foremen, and
superintendents
1,96 2,45 0,49 3,92 5,39 3,92 2,94 9,31
0,00 0,49 30,88 7,35 6,37 3,43 13,73
Semi-skilled and discretionary decision making
2,94 1,96 0,98 0,49 4,41
2,45 0,49 1,96 0,98 0,00 16,67 7,35 4,41
1,47 3,43
Unskilled and defined decision making
10,78 2,94 0,00 0,49 2,45 0,98 0,00 0,00 0,00 0,00 17,65 13,24 3,92 0,00 0,49
Total permanent
19,61
7,35 3,43 17,65 13,24 7,35 4,41 25,00 1,47 0,49 100,00 32,84 14,71
7,84 44,61
A – African
C – Coloured
I – Indian
W – White
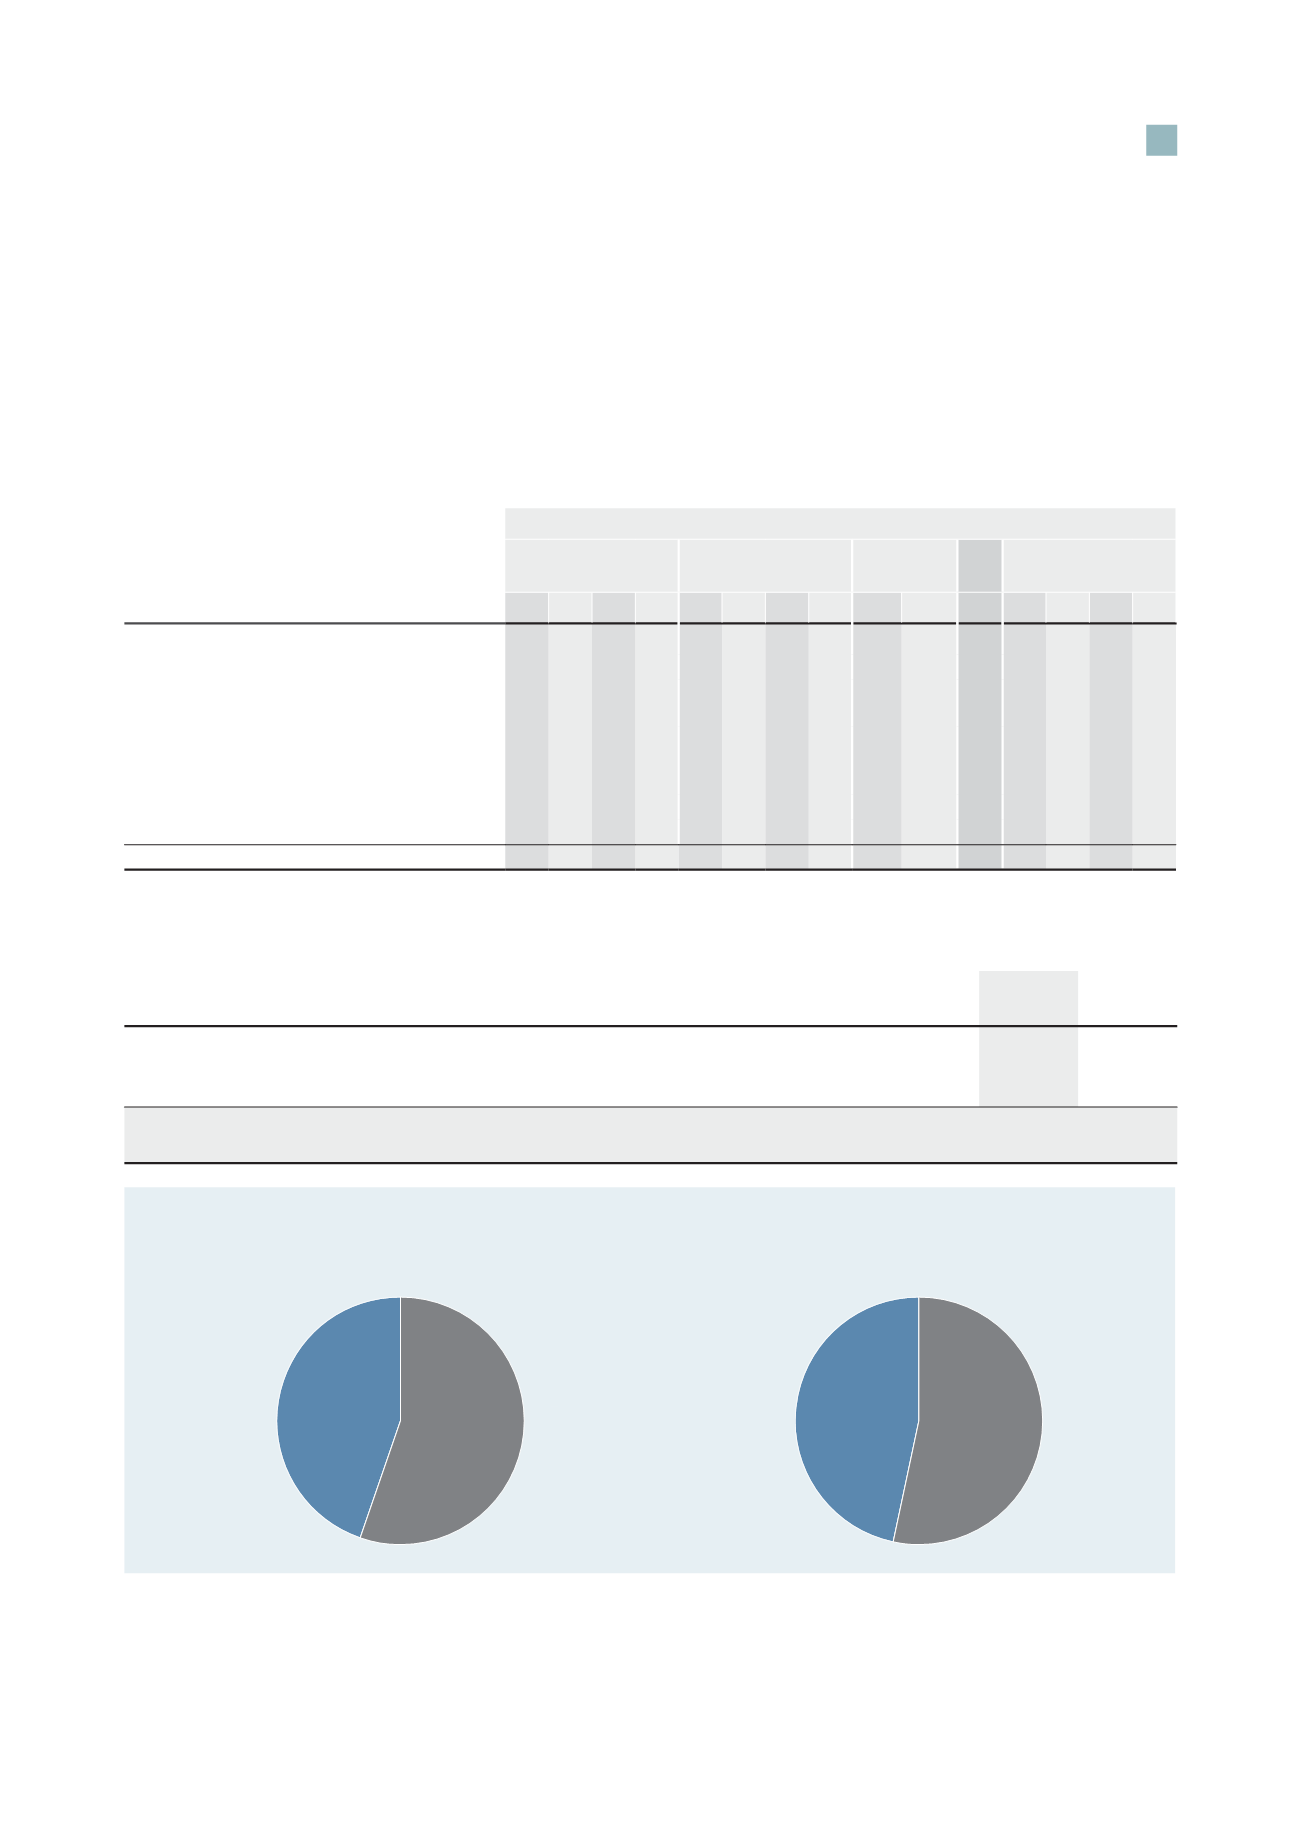
Percentage of total employees by designated groups
2015
%
2014
%
African
32,8
31,7
Coloured
14,7
14,8
Indian
7,8
7,0
Percentage of total staff from designated groups
55,4
53,5
White
44,6
46,5
55,4%
44,6%
O
Total staff from designated groups
O
White
53,5%
46,5%
2014
2015
Percentage of total employees by designated groups
47
Hyprop Investments Limited
Integrated Report 2015