


 56 / 156

Key environmental projects completed in 2015
We completed six projects totalling R7,6 million, focused on installing
energy-efficient lighting to reduce both electricity consumption and
maintenance costs.
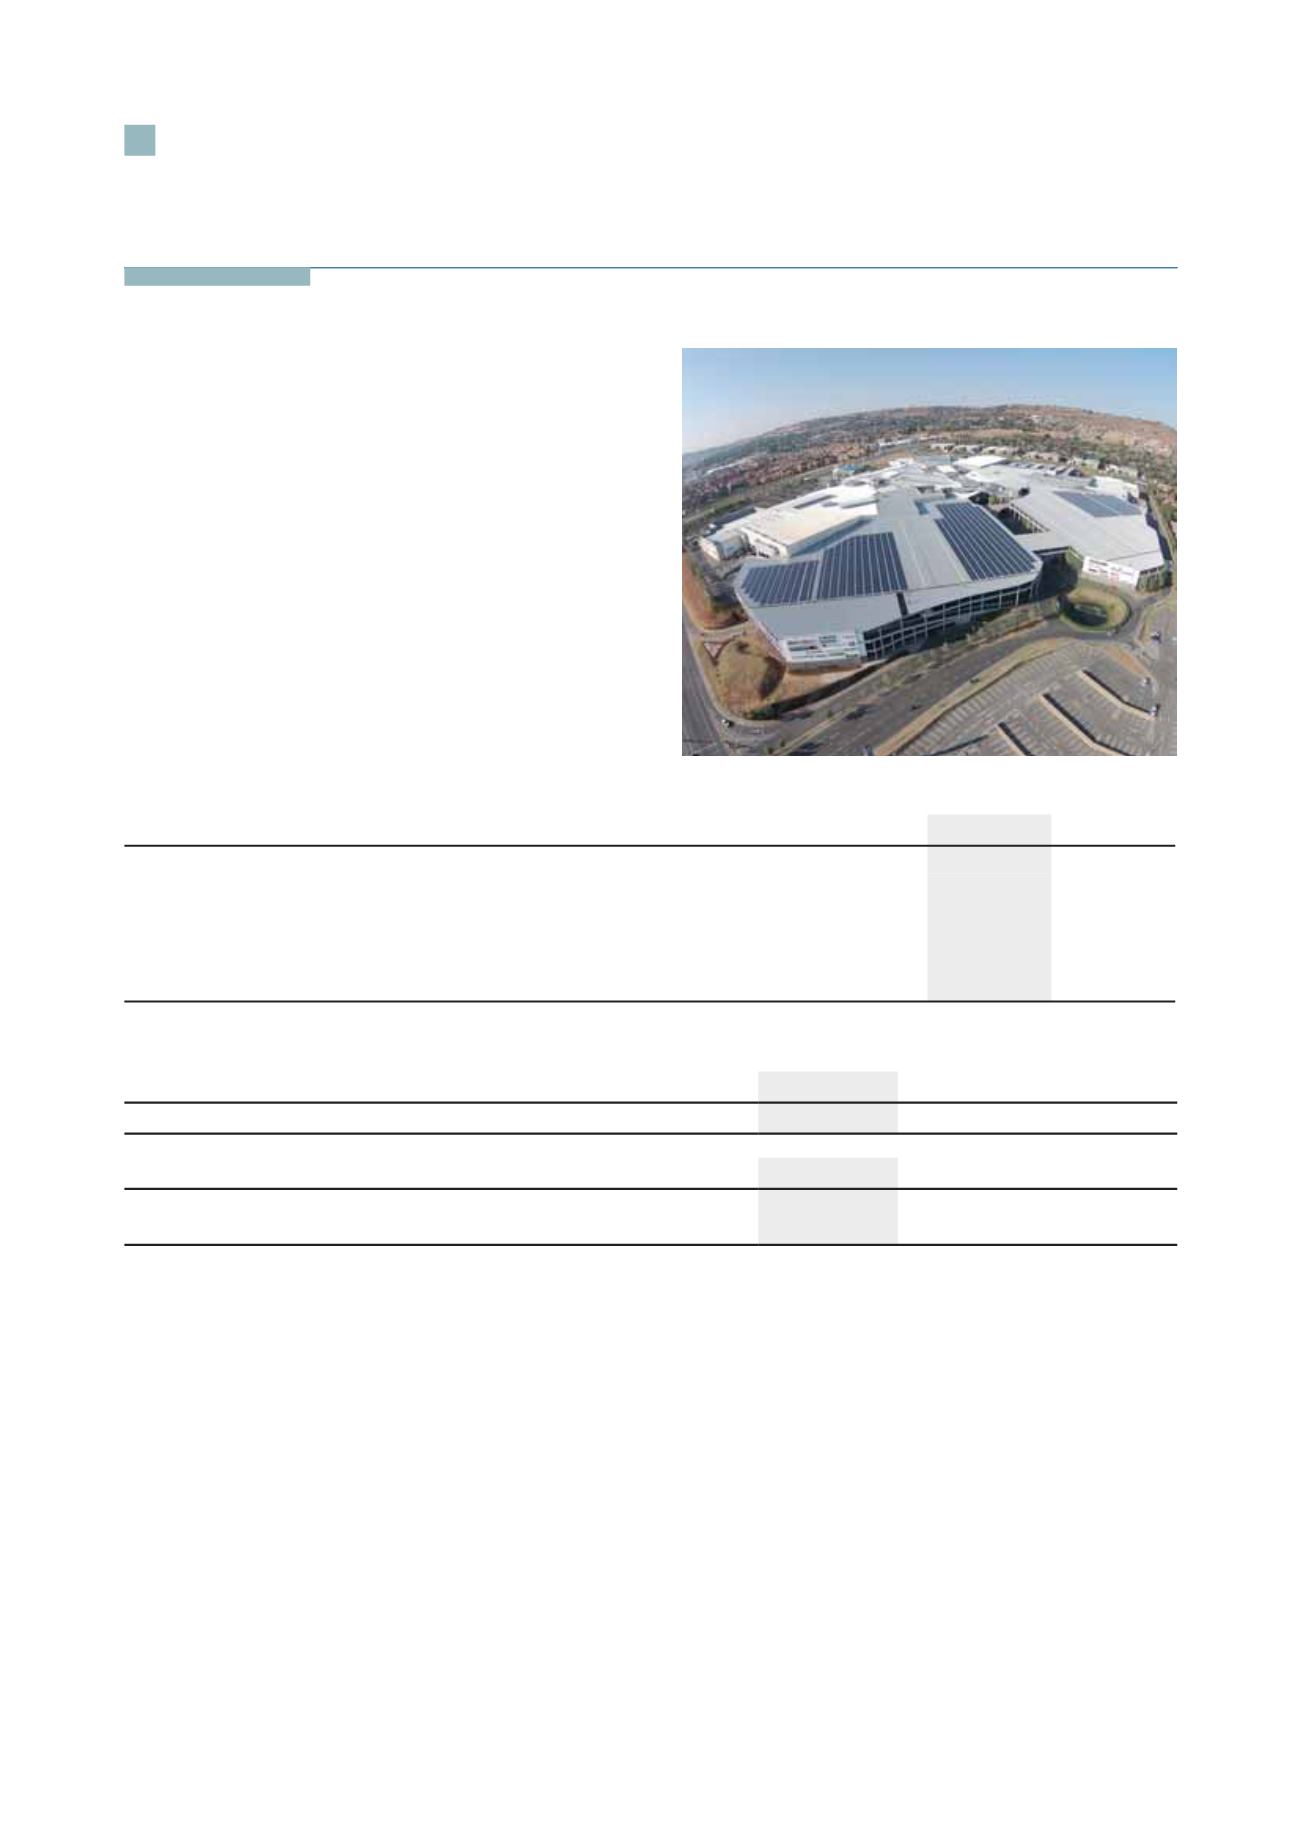
Phase 2 of our solar photovoltaic (PV) plant was installed on Clearwater
Mall’s parking roof (completed in August 2015). The total size of the
plant (phase 1 and 2) is 1 500kW at peak, with generating capacity of
2,5GWh per annum.
Energy-efficiency initiatives
A large portion of Hyprop’s total operational spend in any reporting
year is on electricity (mostly consumed by tenants), energy efficiency is
a financial imperative. We are implementing a range of energy-efficient
solutions to better manage costs for the group and our tenants, to
improve our environmental performance and to reach our targets.
Electrical consumption
2015
2014
Total direct non-renewable energy consumption (gigajoules (GJ)) – ie from diesel burned
5 609
2 950
Total direct renewable energy consumption (GJ) from solar PV
1 839
No PV
Total indirect energy consumption (GJ) – ie from electricity consumed
10 584
9 999
Total indirect energy sold (GJ) – ie electricity recovered from tenants
914 278
875 080
Total electricity consumption (MWh)
256 906 055
277 774 894
Total energy consumption (GJ) – calculated
924 862
999 989
To better monitor the effectiveness of these initiatives and year-on-year consumption patterns, we began calculating our energy use intensity in 2013.
2015
2014 2013 baseline
Energy use intensity (GJ/m
2
)
1,27
1,31
1,56
Kilowatt hours per occupied space (m
2
)
2015
2014
% change
Retail
357
371
(3,7)
Office
268
212
26,4
Determining our carbon footprint
To establish an accurate baseline, we determined the group’s scope 1 and 2 carbon footprint using UK Department for Environment, Food and Rural
Affairs (Defra) voluntary reporting guidelines and the revised corporate accounting and reporting standard of the Greenhouse Gas Protocol, the most
widely used international tool for government and business leaders to understand, quantify and manage greenhouse gas (GHG) emissions.
Hyprop participated in the CDP for the second time this year, submitting our carbon footprint for the 12 months to June 2015. Although our official 2015
score will only be available in November, our score for the prior period was 74%. KPMG has independently audited our 2015 submission, providing an
indicative score of 74% to 80%, which is considered above average.
NATURAL CAPITAL: ENVIRONMENT IMPACT
continued
Clearwater Mall, Johannesburg
54
Hyprop Investments Limited
Integrated Report 2015
SOCIAL AND ETHICS REVIEW