Financial director’s report
 |
Distributions up 11,3% to 472 cents per unit |
|
|
|
Total property assets up 17,5% to R26,4 billion |
|
|
Acquired Somerset Mall (Western Cape) and Manda Hill (Lusaka, Zambia) |
|
|
Investment in sub-Saharan Africa (excluding South Africa)
increased to
R2,2 billion |
|
|
NAV increased by 11,1% to R76,02 cents per unit |
|
| |
|
|
Introduction
The year under review has been a successful one for Hyprop. The core portfolio continues to deliver solid results, while redevelopment of Rosebank Mall met significant milestones ahead of completion in September 2014.
Progress with investments in sub-Saharan Africa (excluding South Africa) included the restructure of African Land, effective 1 July 2014.
Condensed statement of distributable earnings
| |
Audited
30 June
2014
Rm |
|
Unaudited
12 months
30 June
2013
Rm |
|
% |
|
| Revenue |
2 392 |
|
2 172 |
|
|
|
| Investment property |
2 355 |
|
2 023 |
|
16,4 |
|
| Listed investments |
37 |
|
149 |
|
(75,0) |
|
| Property expenses |
(821) |
|
(697) |
|
17,8 |
|
| Net property income |
1 571 |
|
1 475 |
|
6,5 |
|
| Other operating expenses |
(56) |
|
(56) |
|
|
|
| Operating income |
1 515 |
|
1 419 |
|
6,8 |
|
| Atterbury Africa |
5 |
|
1 |
|
|
|
| African Land |
30 |
|
|
|
|
|
| Net income before interest |
1 550 |
|
1 420 |
|
9,2 |
|
| Net interest |
(401) |
|
(388) |
|
3,6 |
|
| Distributable earnings |
1 149 |
|
1 032 |
|
11,3 |
|
| Number of combined units (000) |
243 256 |
|
243 113 |
|
|
|
| Distribution per combined unit (cents) |
472,0 |
|
424,0 |
|
11,3 |
|
Financial performance
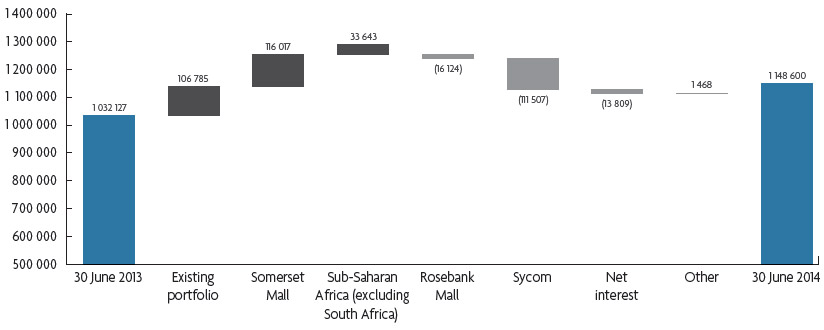
Distributable earnings from regional, large regional and super-regional malls (excluding Somerset Mall, acquired 1 October 2013) increased by 9,5%, with average growth of 11,0% from The Glen, Clearwater and Woodlands. The Glen benefited from the expansion of Edgars by 2 700m2 and reduced assessment rates while Clearwater and Woodlands benefited from turnover rental of R10,1 million and lower municipal expenses.
Rosebank Mall continued to be affected by the redevelopment, with distributable earnings decreasing by R16,1 million. This was in line with budget.
Property expenses were well contained with the cost-to-income ratio was marginally lower at 34,4% (30 June 2013: 34,9%). The total cost-to-income ratio at fund level increased to 37,3% from 35,1%. This was due to a reduction in income from listed investments, after disposing of the investment in Sycom and the once-off consolidation of fund management costs relating to African Land.
Net interest paid increased by 3,6% year-on-year. The increase was marginal due to proceeds from disposals of R205 million, reducing short-term funding requirements.
Total arrears (excluding Rosebank Mall) at 30 June 2014 were R14,3 million (30 June 2013: R17,1 million). This constitutes 0,4% (30 June 2013: 0,5%) of rental income and includes Somerset Mall. The corresponding allowance for doubtful debts was R7,1 million (30 June 2013: R6,7 million).
| Drivers of distribution growth
|
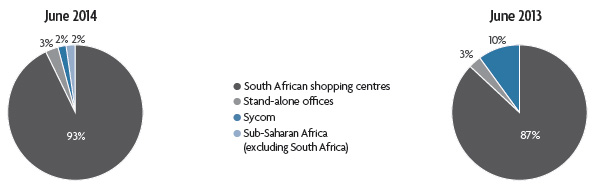
| Net income — stronger contribution from shopping centres
|
In line with Hyprop’s strategy to focus on prime-quality shopping centres, the contribution of shopping centres to net income grew from 87% a year ago to 93% this year. In addition, sub-Saharan Africa (excluding South Africa) contributed 2% to net income.
Income from listed property securities decreased from 10% of total income a year ago to 2% currently, following the exchange of Somerset Mall for the investment in Sycom and the subsequent disposal of the remaining units.
Investment property
Investment property was independently valued at year-end and increased to R25,6 billion (30 June 2013: R19,8 billion). This was driven primarily by income growth and the acquisition of Somerset Mall and Manda Hill Shopping Centre (African Land).
Property portfolio
|
|
Value attributable to Hyprop |
Value per
rentable area |
| Business segment |
Rentable
area
(m2) |
30 June
2014
R000 |
30 June
2013
R000 |
30 June
2014
(R/m2) |
| Canal Walk (80%) |
157 031 |
6 064 000 |
5 627 200 |
48 271 |
| Super regional |
157 031 |
6 064 000 |
5 627 200 |
48 271 |
| Clearwater |
86 028 |
3 473 000 |
3 203 000 |
40 371 |
| The Glen (75,15%) |
76 849 |
2 059 269 |
1 854 094 |
35 654 |
| Woodlands Boulevard |
71 617 |
2 196 000 |
1 886 000 |
30 663 |
| CapeGate(1) |
98 567 |
1 738 000 |
1 602 000 |
17 633 |
| Somerset Mall |
66 831 |
2 252 000 |
|
33 697 |
| Large regional |
399 892 |
11 718 269 |
8 545 094 |
31 006 |
| Hyde Park |
38 345 |
1 769 000 |
1 556 000 |
46 134 |
| Regional |
38 345 |
1 769 000 |
1 556 000 |
46 134 |
| Atterbury Value Mart |
47 786 |
1 105 000 |
987 000 |
23 124 |
| Willowbridge(2) |
43 001 |
594 000 |
585 000 |
13 814 |
| Stoneridge(2) (90%) |
48 584 |
432 000 |
421 200 |
9 880 |
| Somerset Value Mart |
12 386 |
185 000 |
185 000 |
14 936 |
| Value centres |
151 757 |
2 316 000 |
2 178 200 |
15 578 |
| Shopping centres |
747 025 |
21 867 269 |
17 906 494 |
32 277 |
| Stand-alone offices(3) |
34 114 |
457 000 |
442 000 |
13 396 |
| Development property(4) |
|
1 849 000 |
1 494 000 |
|
| African Land(5) |
|
1 408 262 |
|
|
| Investment property |
781 139 |
25 581 531 |
19 842 494 |
|
| Listed property securities(6) |
|
|
2 279 253 |
|
| Investment in Atterbury Africa |
|
812 459 |
336 994 |
|
| |
781 139 |
26 393 990 |
22 458 741 |
|
Held for sale
In line with our strategy to dispose of non-core assets, we are disposing of our stand-alone office portfolio, as well as Stoneridge Centre, Willowbridge and CapeGate Lifestyle. As a result, these properties have been classified as held for sale and in total amount to R1,7 billion.
Investments in sub-Saharan Africa
(excluding South Africa)
Atterbury Africa
Hyprop received a dividend of R4,8 million from its investment in Atterbury Africa, through its wholly owned subsidiary, Hyprop Investments (Mauritius). Accra Mall in Ghana is currently Atterbury Africa’s only income-producing property.
Hyprop’s effective investment in Atterbury Africa increased to R812 million (30 June 2013: R337 million), primarily due to capital contributions for the West Hills Mall development (Accra, Ghana) and land acquisitions in Ghana.
African Land
Hyprop received a dividend of R30,3 million from African Land for the year.
Post-year-end, the investment was restructured (effective 1 July 2014), with Hyprop Investments (Mauritius) now holding 50% in Manda Hill (Lusaka, Zambia), African Land’s only asset. Atterbury Africa will hold the balance.
Following the restructure, Hyprop’s effective interest in Manda Hill will be 68,75%, down from 87%.
Net asset value (NAV)
The NAV per combined unit at 30 June 2014 rose by 11,1% to R76,02 (30 June 2013: R68,43). This was primarily due to an increase in the independent valuation of the investment property portfolio.
At 30 June 2014, the closing combined unit price of R79,51 represented a premium of 4,6% to the NAV per combined unit.
Borrowings
|
| |
30 June
2014
Rm |
30 June
2013
Rm |
| South African bank facilities |
3 509 |
3 404 |
| Debt capital market (DCM) |
|
|
| Corporate bonds |
1 600 |
1 150 |
| Commercial paper |
697 |
498 |
| US dollar debt |
1 393 |
333 |
| Cash and cash equivalents |
(125) |
(240) |
| Net borrowings |
7 074 |
5 145 |
| Gearing (%) |
28,4 |
22,9 |
Net borrowings increased to R7,1 billion at 30 June 2014 (30 June 2013: R5,1 billion) mainly as a result of capital expenditure on the Rosebank Mall redevelopment, the acquisition of African Land and developments in Atterbury Africa.
Investments in sub-Saharan Africa (excluding South Africa) are made with US dollar funding.
The gearing ratio, at 28,4%, is slightly below Hyprop’s ideal range of 30% to 40%. Higher gearing levels depend to a large extent on corporate activity, particularly acquisitions. In the absence of significant acquisitions, it is unlikely that the gearing ratio will reach these levels.
At year-end, interest rates were hedged for 71,4% (30 June 2013: 87%) of borrowings, at a weighted average rate of 7,5% (30 June 2013: 8,1%). Following African Land’s restructure, the ratio of fixed-rate debt will increase to approximately 80% of total debt.
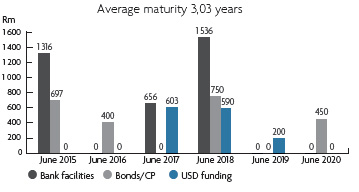
Bank facilities amounting to approximately R2 billion (drawn-down amount at 30 June 2014: R1,3 billion) will mature in the next 12 months. This will provide an opportunity to increase the average maturity profile of debt facilities and possibly also increase the ratio of DCM funding.
We will consider both conventional bank funding and DCM funding as potential avenues for refinancing, with the aim of leveraging off a sound balance sheet to reduce the average cost of funding and increase the maturity profile.
The maturity profile of our various debt facilities, fixed rates and swaps is shown below:
Debt maturity profile: bank facilities
and debt
capital market funding
 |
|
Maturity profile: fixed interest rates and swaps
 |
|
Cash management
Contractual rental income comprises 97% of Hyprop’s revenue from direct property investments. All rental income earned by the company, less property expenses and interest on debt, is distributed to shareholders semi-annually.
Cash collected between distribution payments is paid into floating rate debt facilities to benefit from the interest saving.
New developments and capital expenditure are funded with debt while acquisitions, depending on their size, may be funded in part by equity. Proceeds from the sale of non-core assets will be applied to capital expenditure, developments and the reduction of debt.
Appreciation
I thank the finance team for their dedication, commitment and hard work during the year. I also extend my appreciation to my fellow board members for their sound advice and valued guidance.
Laurence Cohen
Financial director
|