

Value added statement
Hyde Park Corner, Gauteng
|
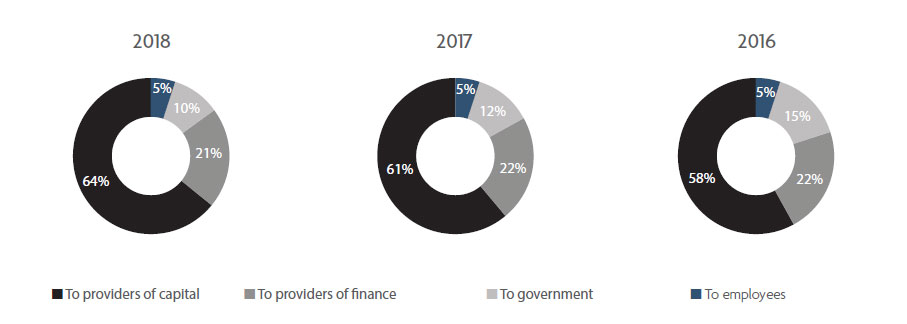
Value added is a measure of the wealth created by the group and its employees through its business activities. |
The table below sets out the value added and how it was shared.
| June 2018 Rm |
June 2017 Rm |
June 2016 Rm |
||||||
| Income from: | 2 971 | 2 838 | 2 658 | |||||
|---|---|---|---|---|---|---|---|---|
| South Africa property portfolio | 2 705 | 2 679 | 2 549 | |||||
| Sub-Saharan Africa | 78 | 57 | 84 | |||||
| South-Eastern Europe | 188 | 102 | 25 | |||||
| Other income | 47 | 37 | 7 | |||||
| Fund management expenses | (65) | (67) | (64) | |||||
| Antecedent dividend | 17 | |||||||
| Total value created | 2 953 | 2 808 | 2 618 | |||||
| Value distribution | Rm | % of total | Rm | % of total | Rm | % of total | ||
| To employees | ||||||||
| Remuneration and benefits | 158 | 5,4 | 144 | 5,1 | 128 | 4,9 | ||
| To providers of finance | ||||||||
| Net finance costs | 281 | 9,5 | 321 | 11,5 | 394 | 15,1 | ||
| To government | ||||||||
| Municipal charges | 609 | 20,6 | 618 | 22,0 | 574 | 21,9 | ||
| To providers of capital | ||||||||
| Distribution to shareholders | 1 905 | 64,5 | 1 725 | 61,4 | 1 522 | 58,1 | ||
| Total value distributed | 2 953 | 2 808 | 2 618 |
| Value added statement |
 |